Visualize and understand all your hotspot data

Hotspotty provides more comprehensive and detailed information about your Helium hotspots than any other tool.

Import and view selected wallets for your portfolio

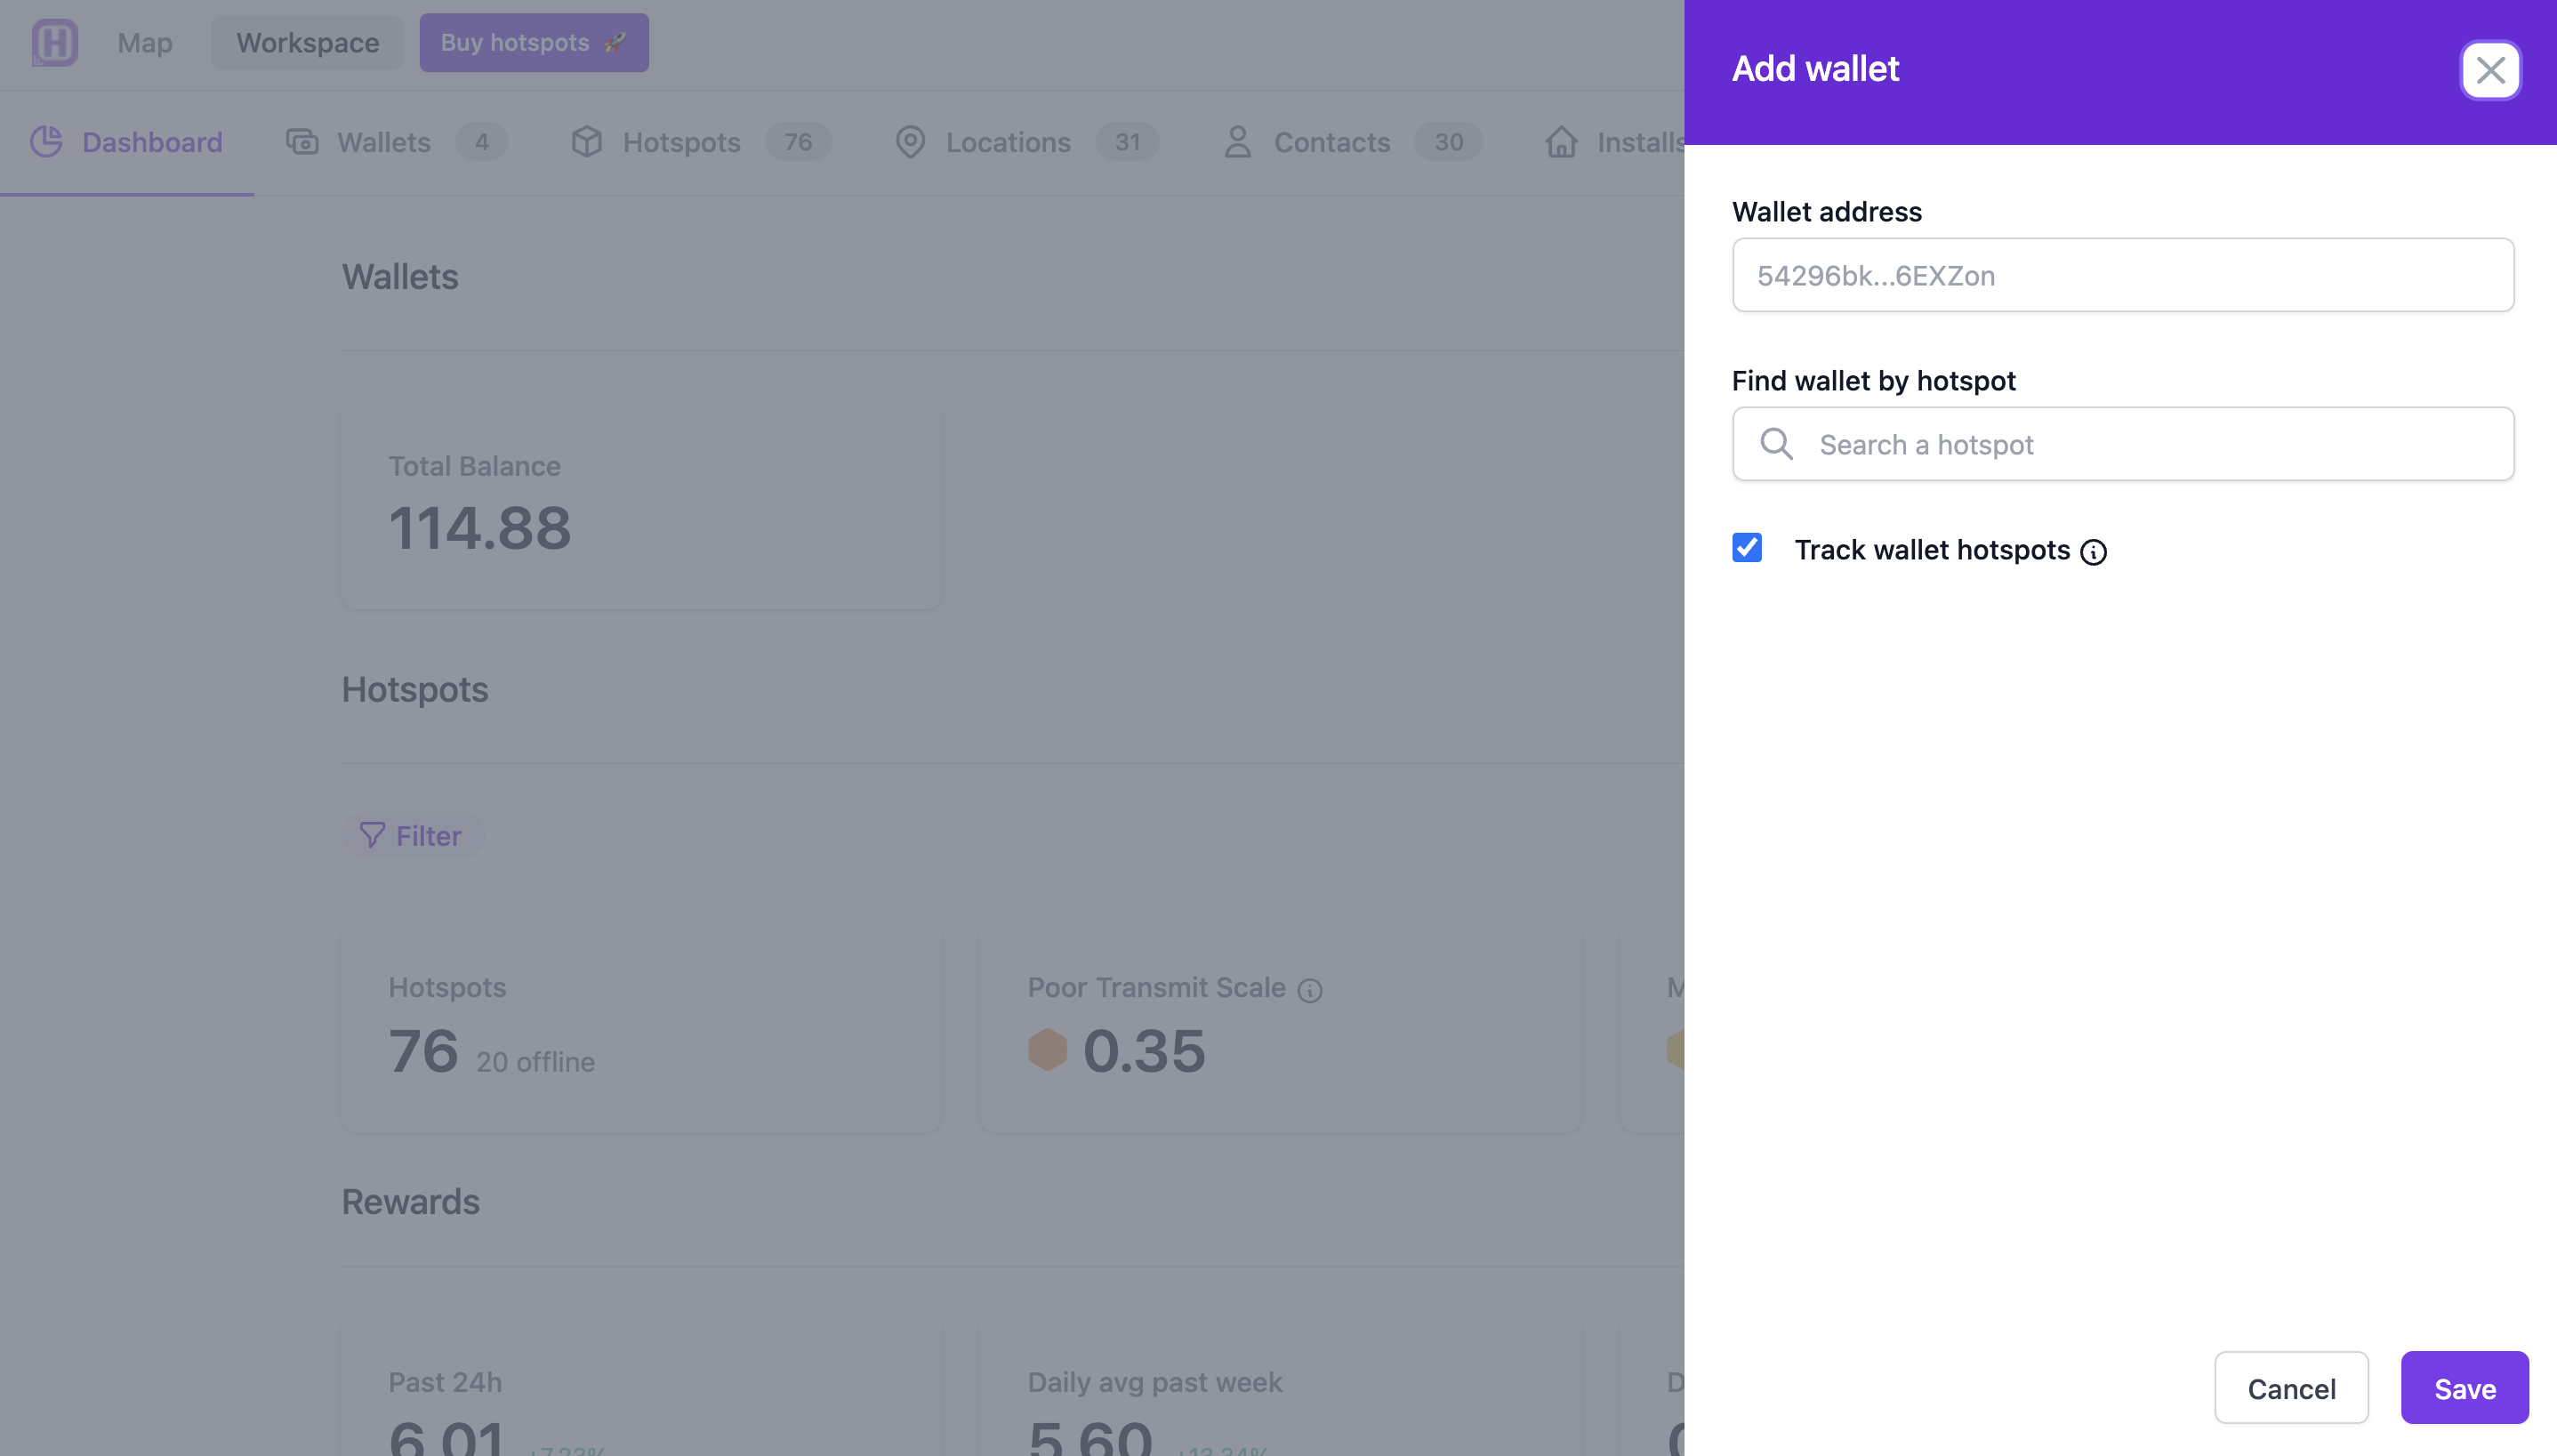
Get started by adding whole wallets by address or find wallets by individual hotspot names – and add individual hotspots to your portfolio.

See everything about all your wallets - in one place

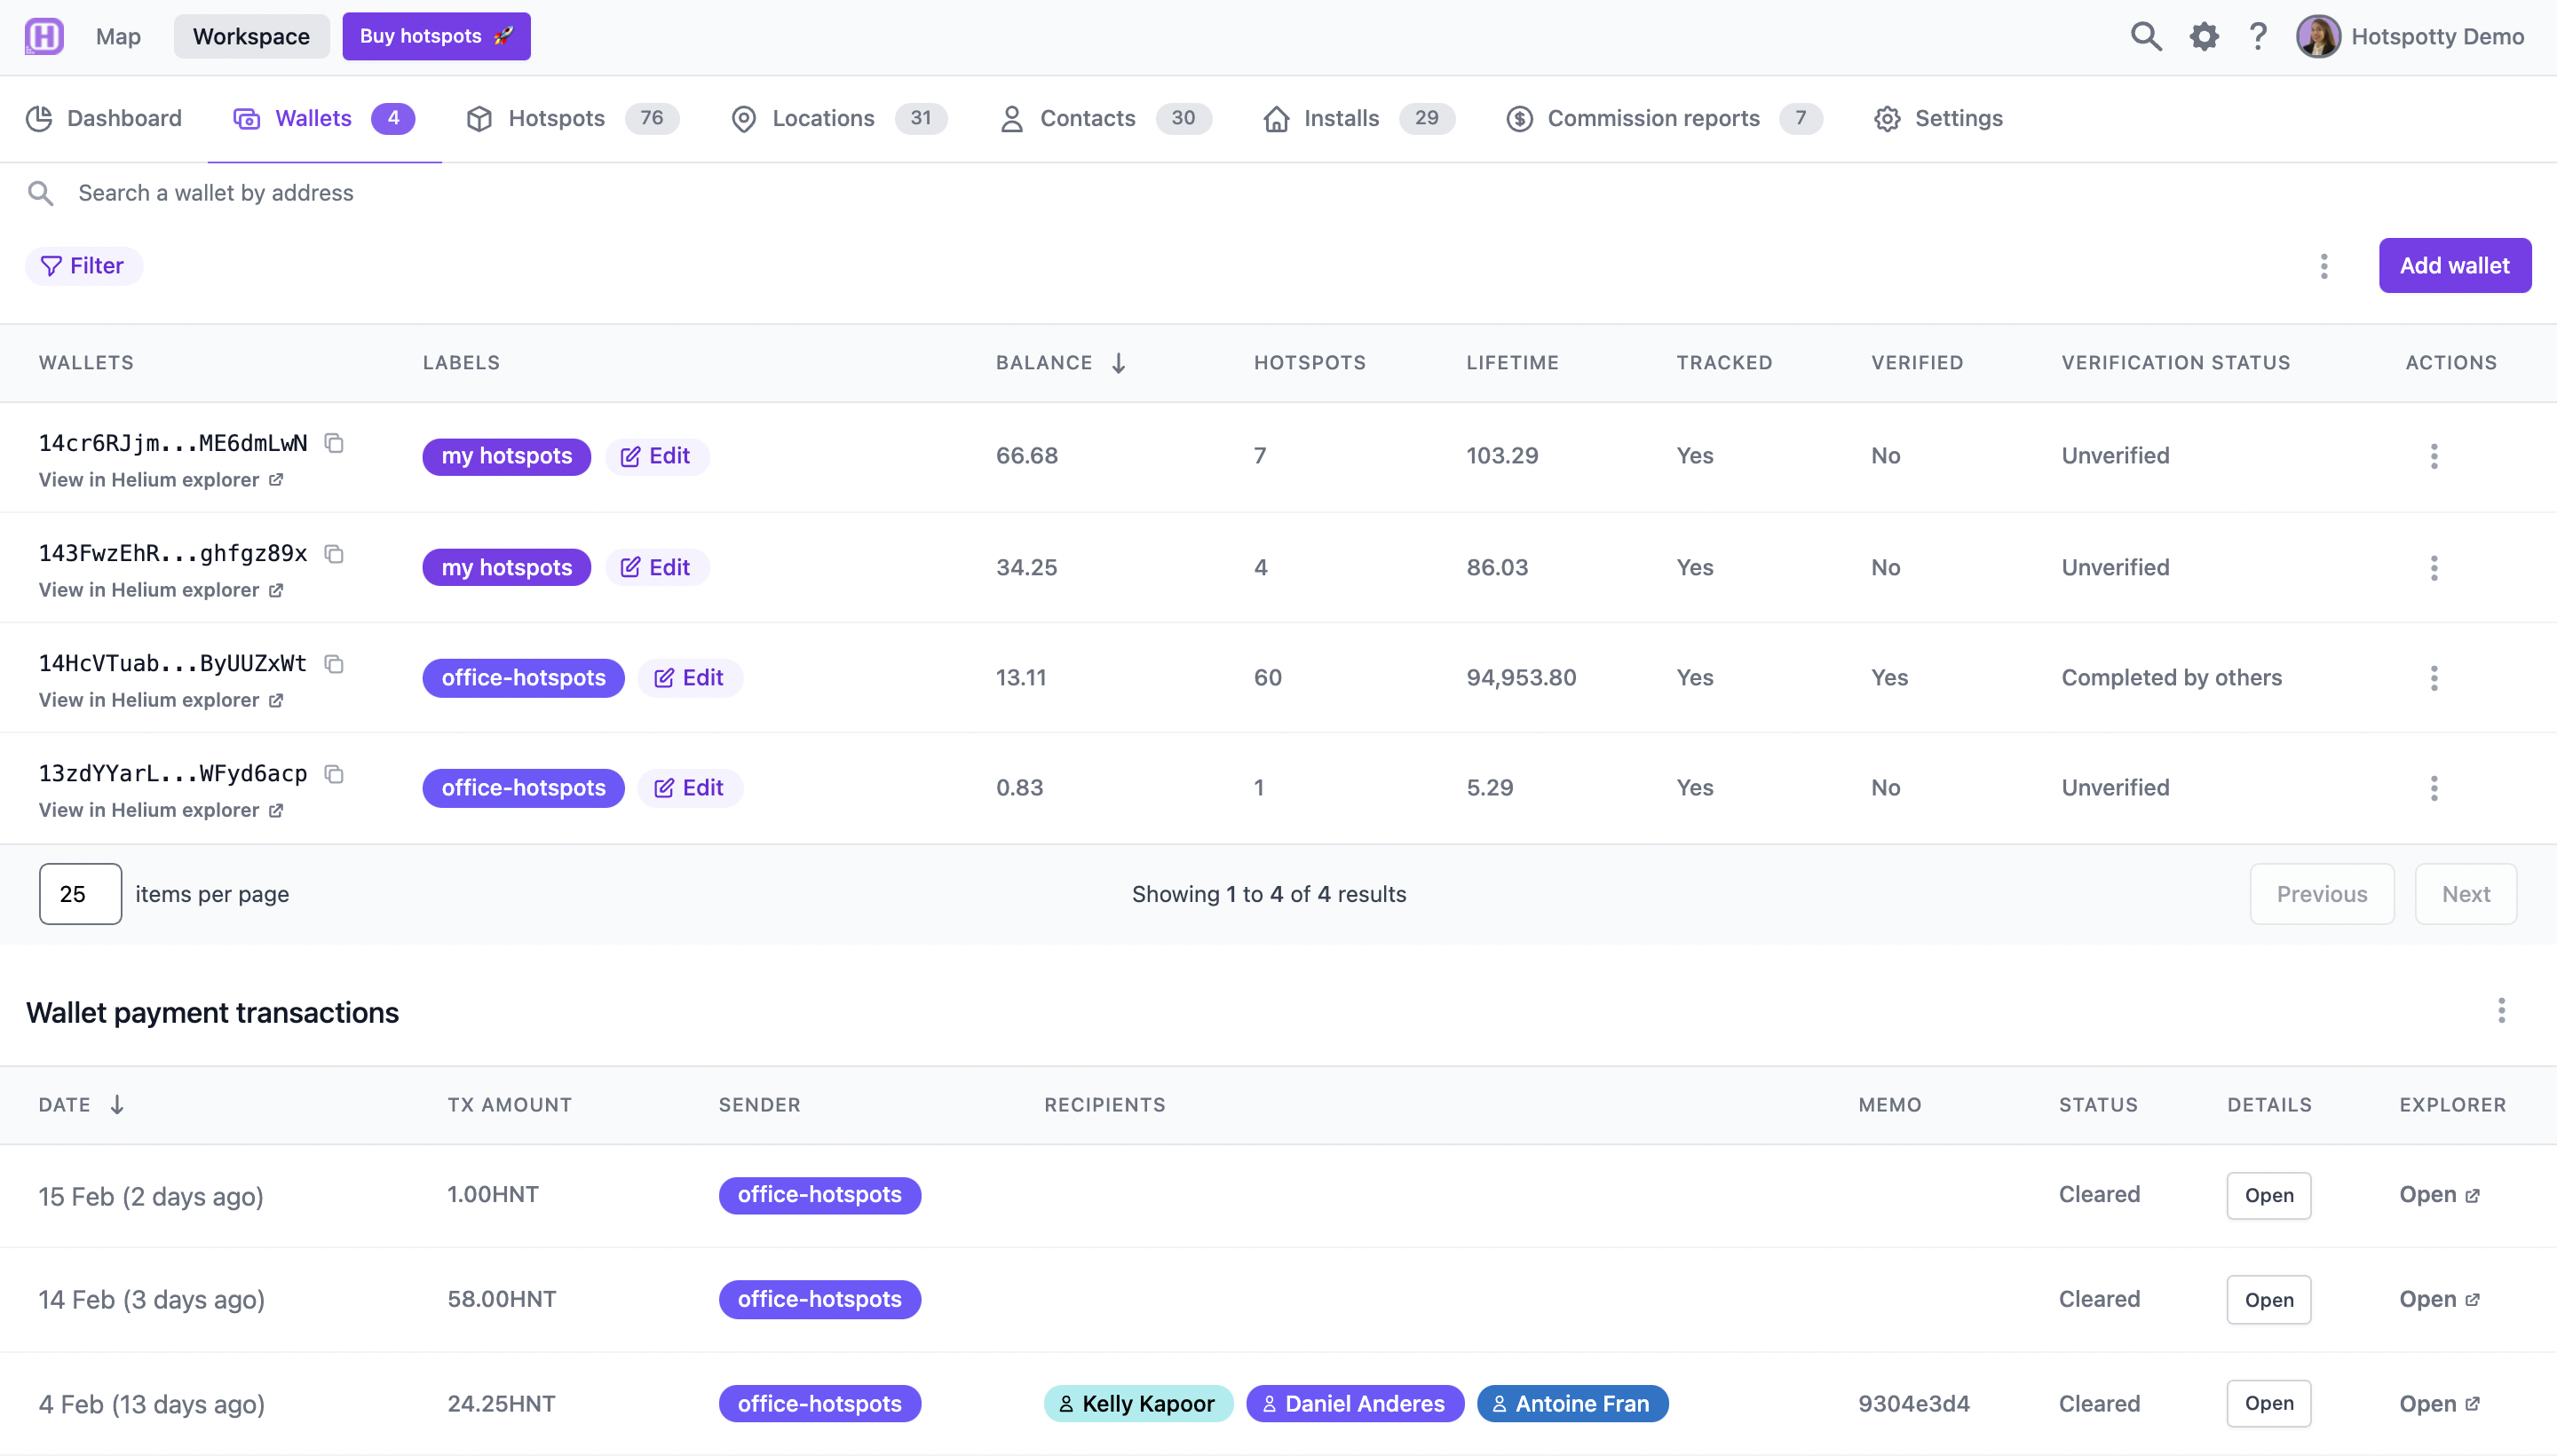
The wallets overview shows you all the wallets you have added, including their lifetime and current balance, number of attached hotspots, and verification status. You can also see a list of all wallet payment transactions, as well as the date, amount sender, recipient, and payment status.

Understand your entire hotspot portfolio performance, at a glance

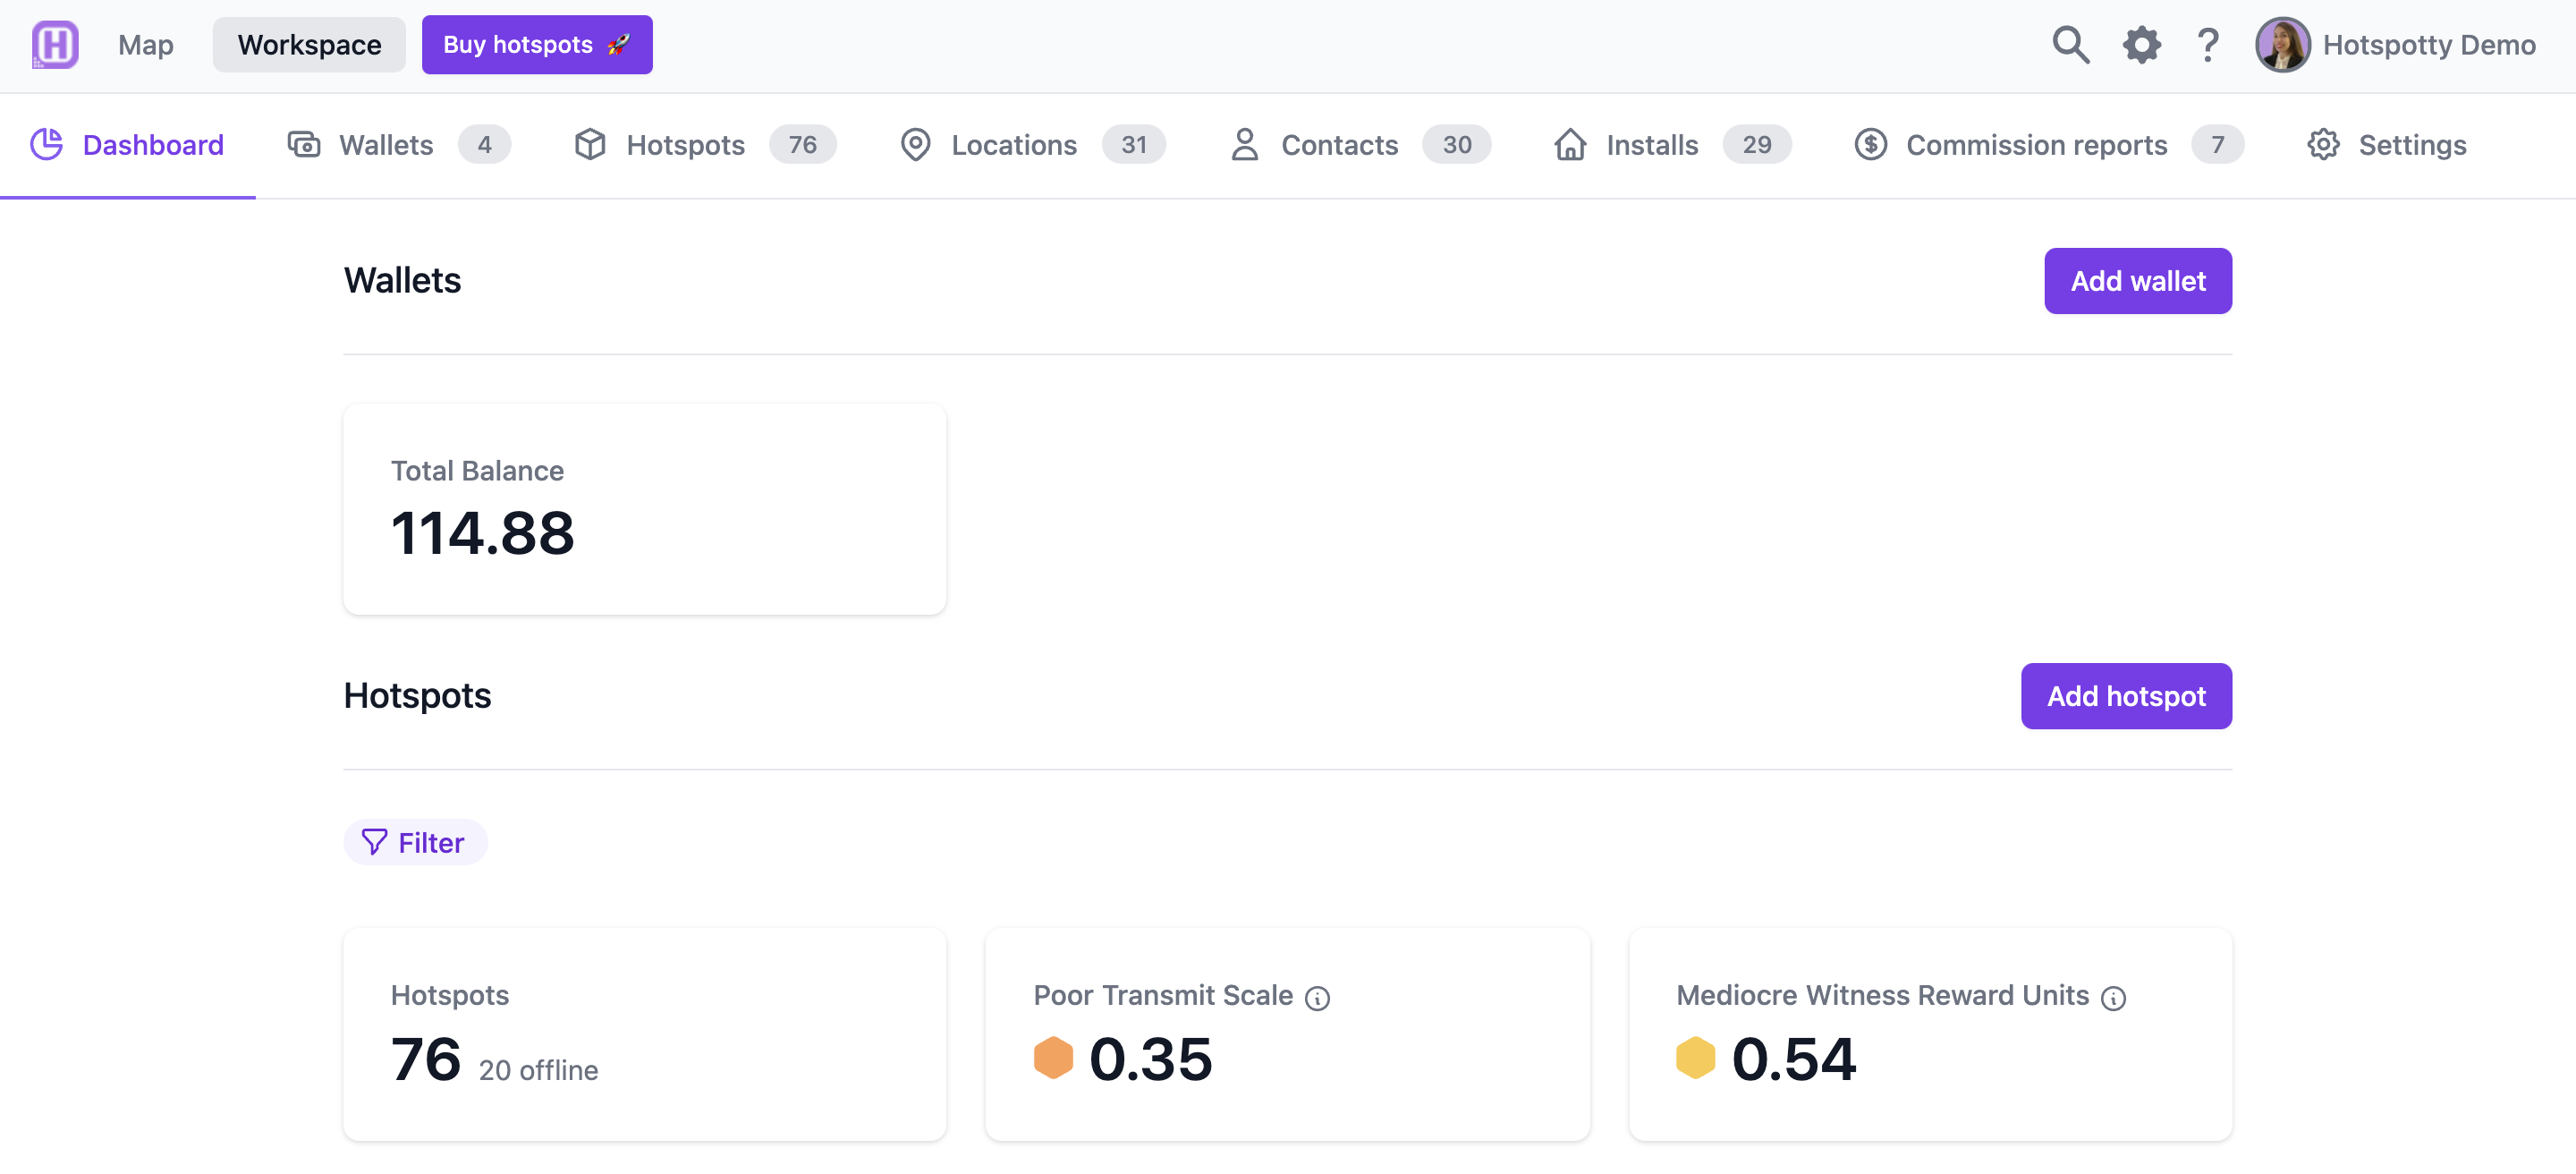
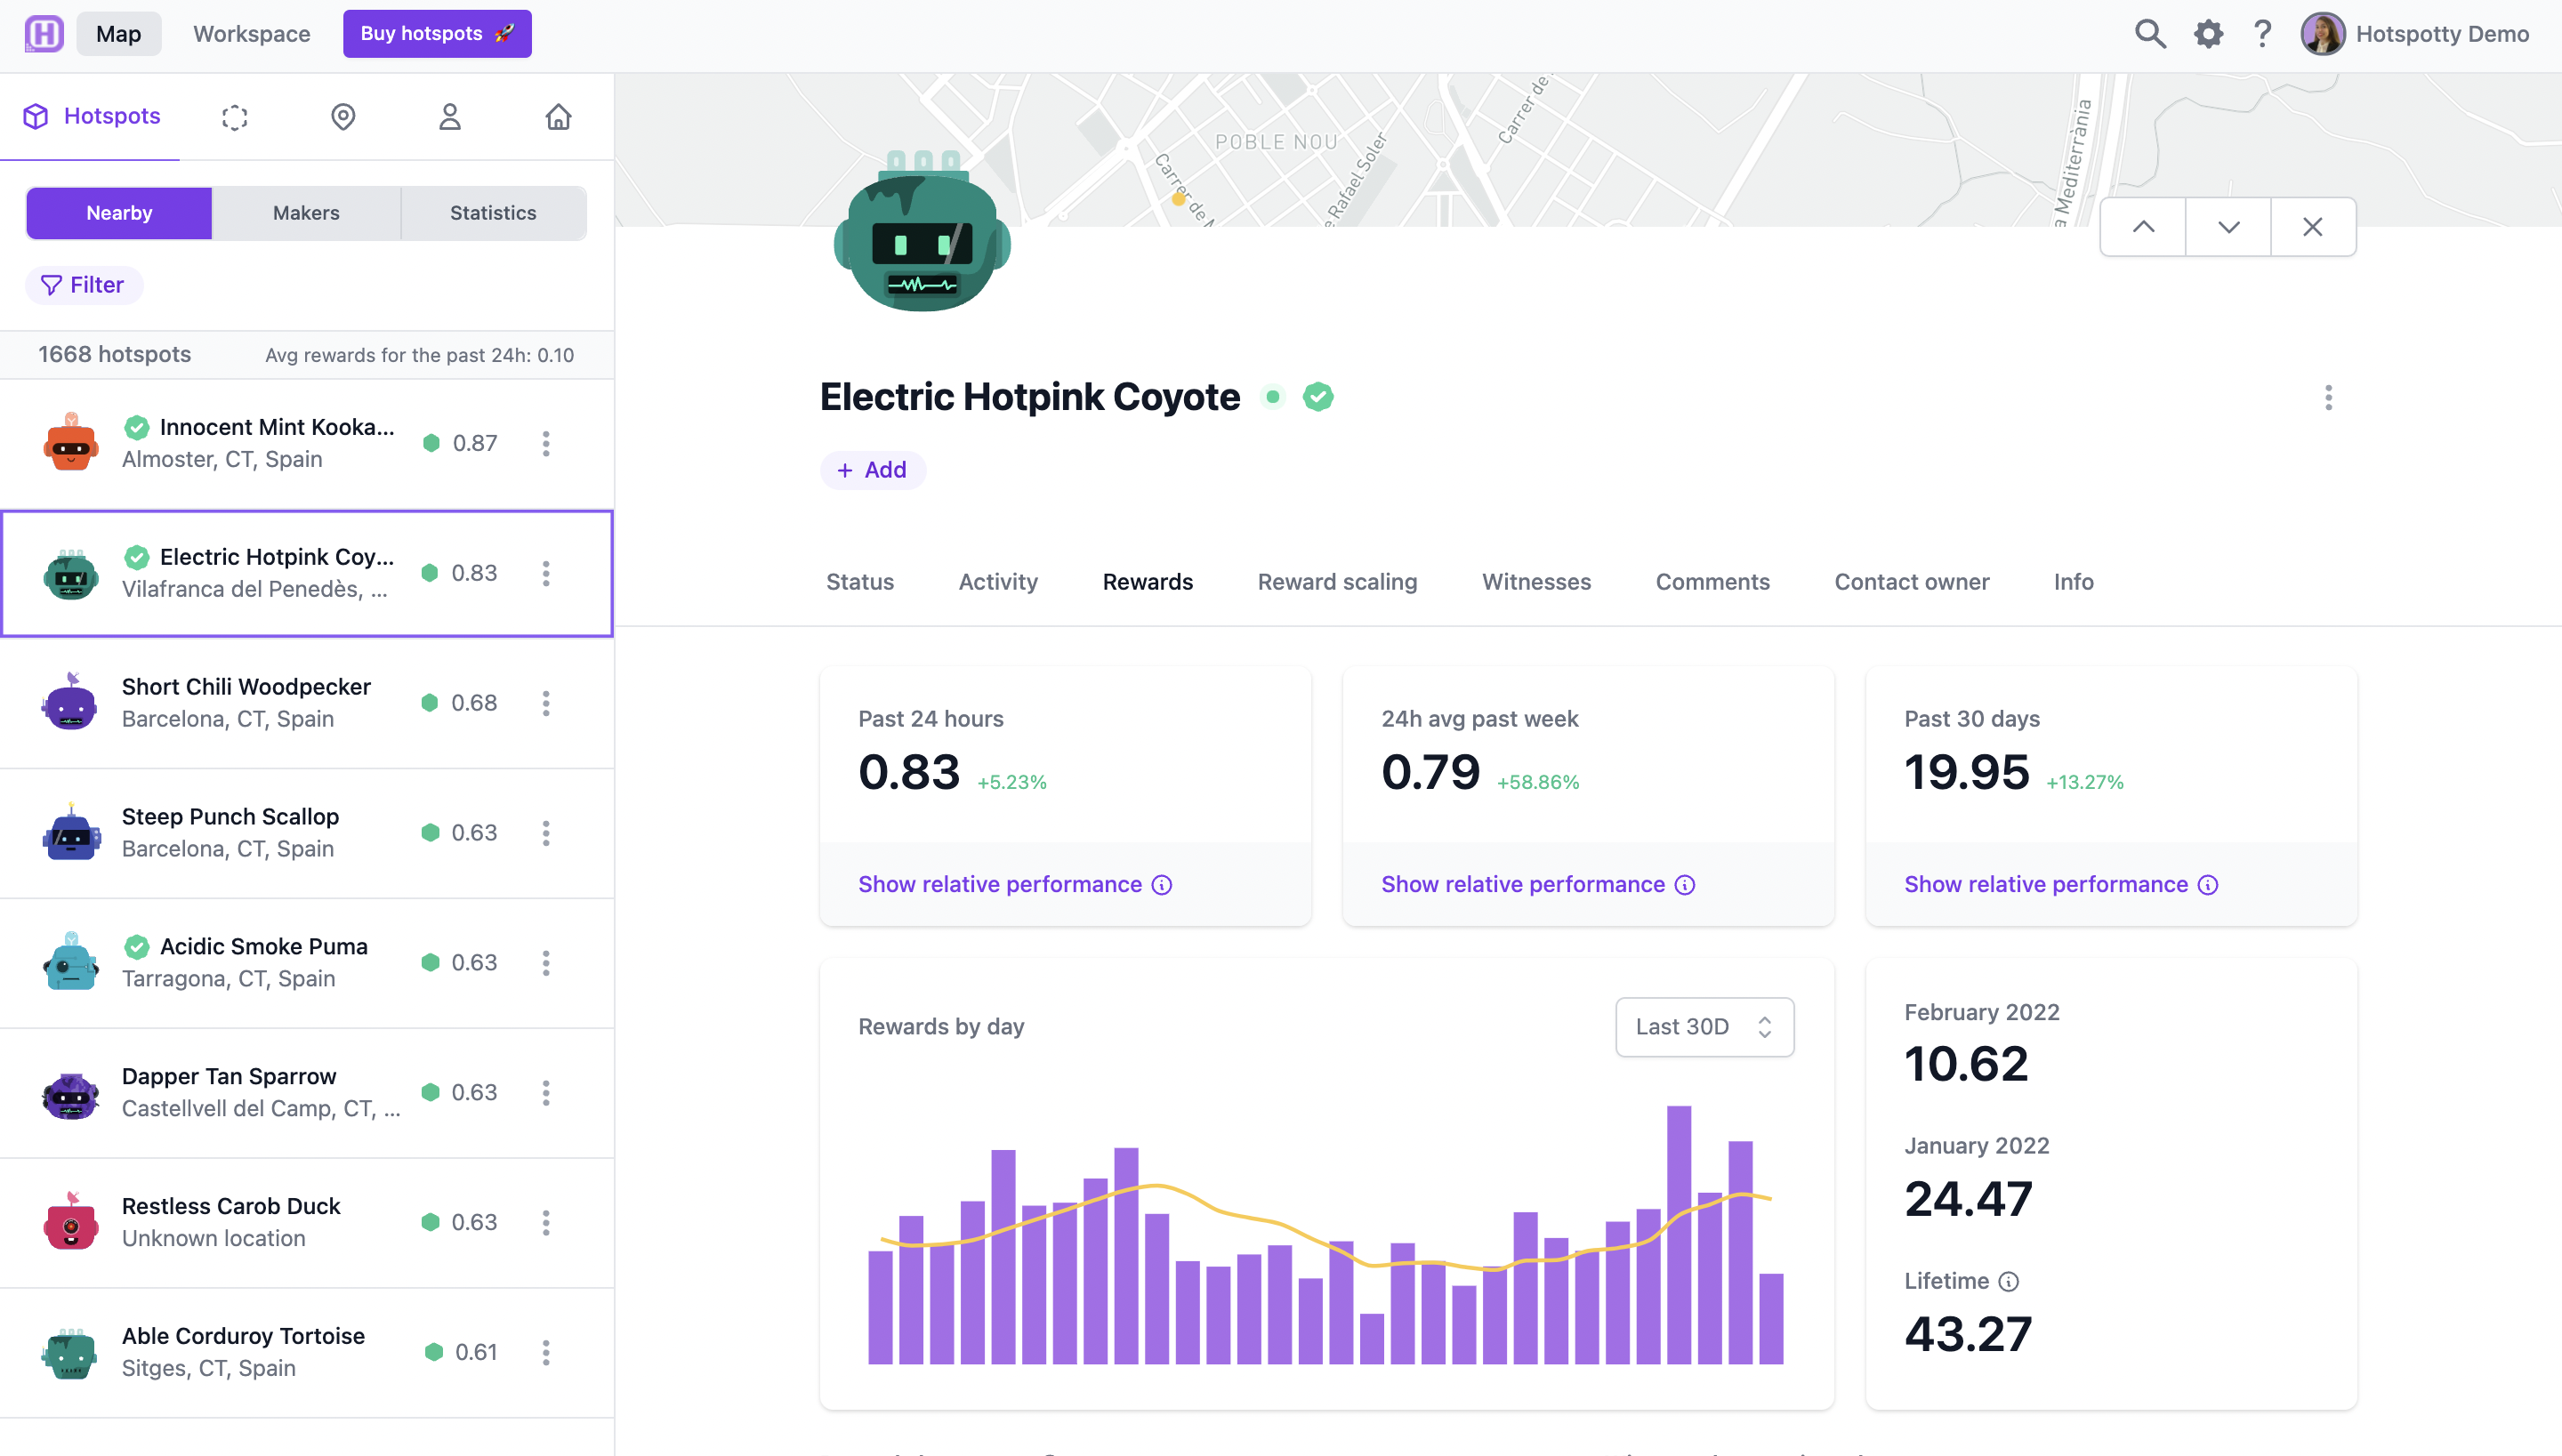
The dashboard visualizes the key statistics and data points you need to know about your portfolio of hotspots, and individual hotspots, including rewards by type and reward performance over time – with rolling averages that make it easy to spot the important trends.

Warnings to support more advanced troubleshooting

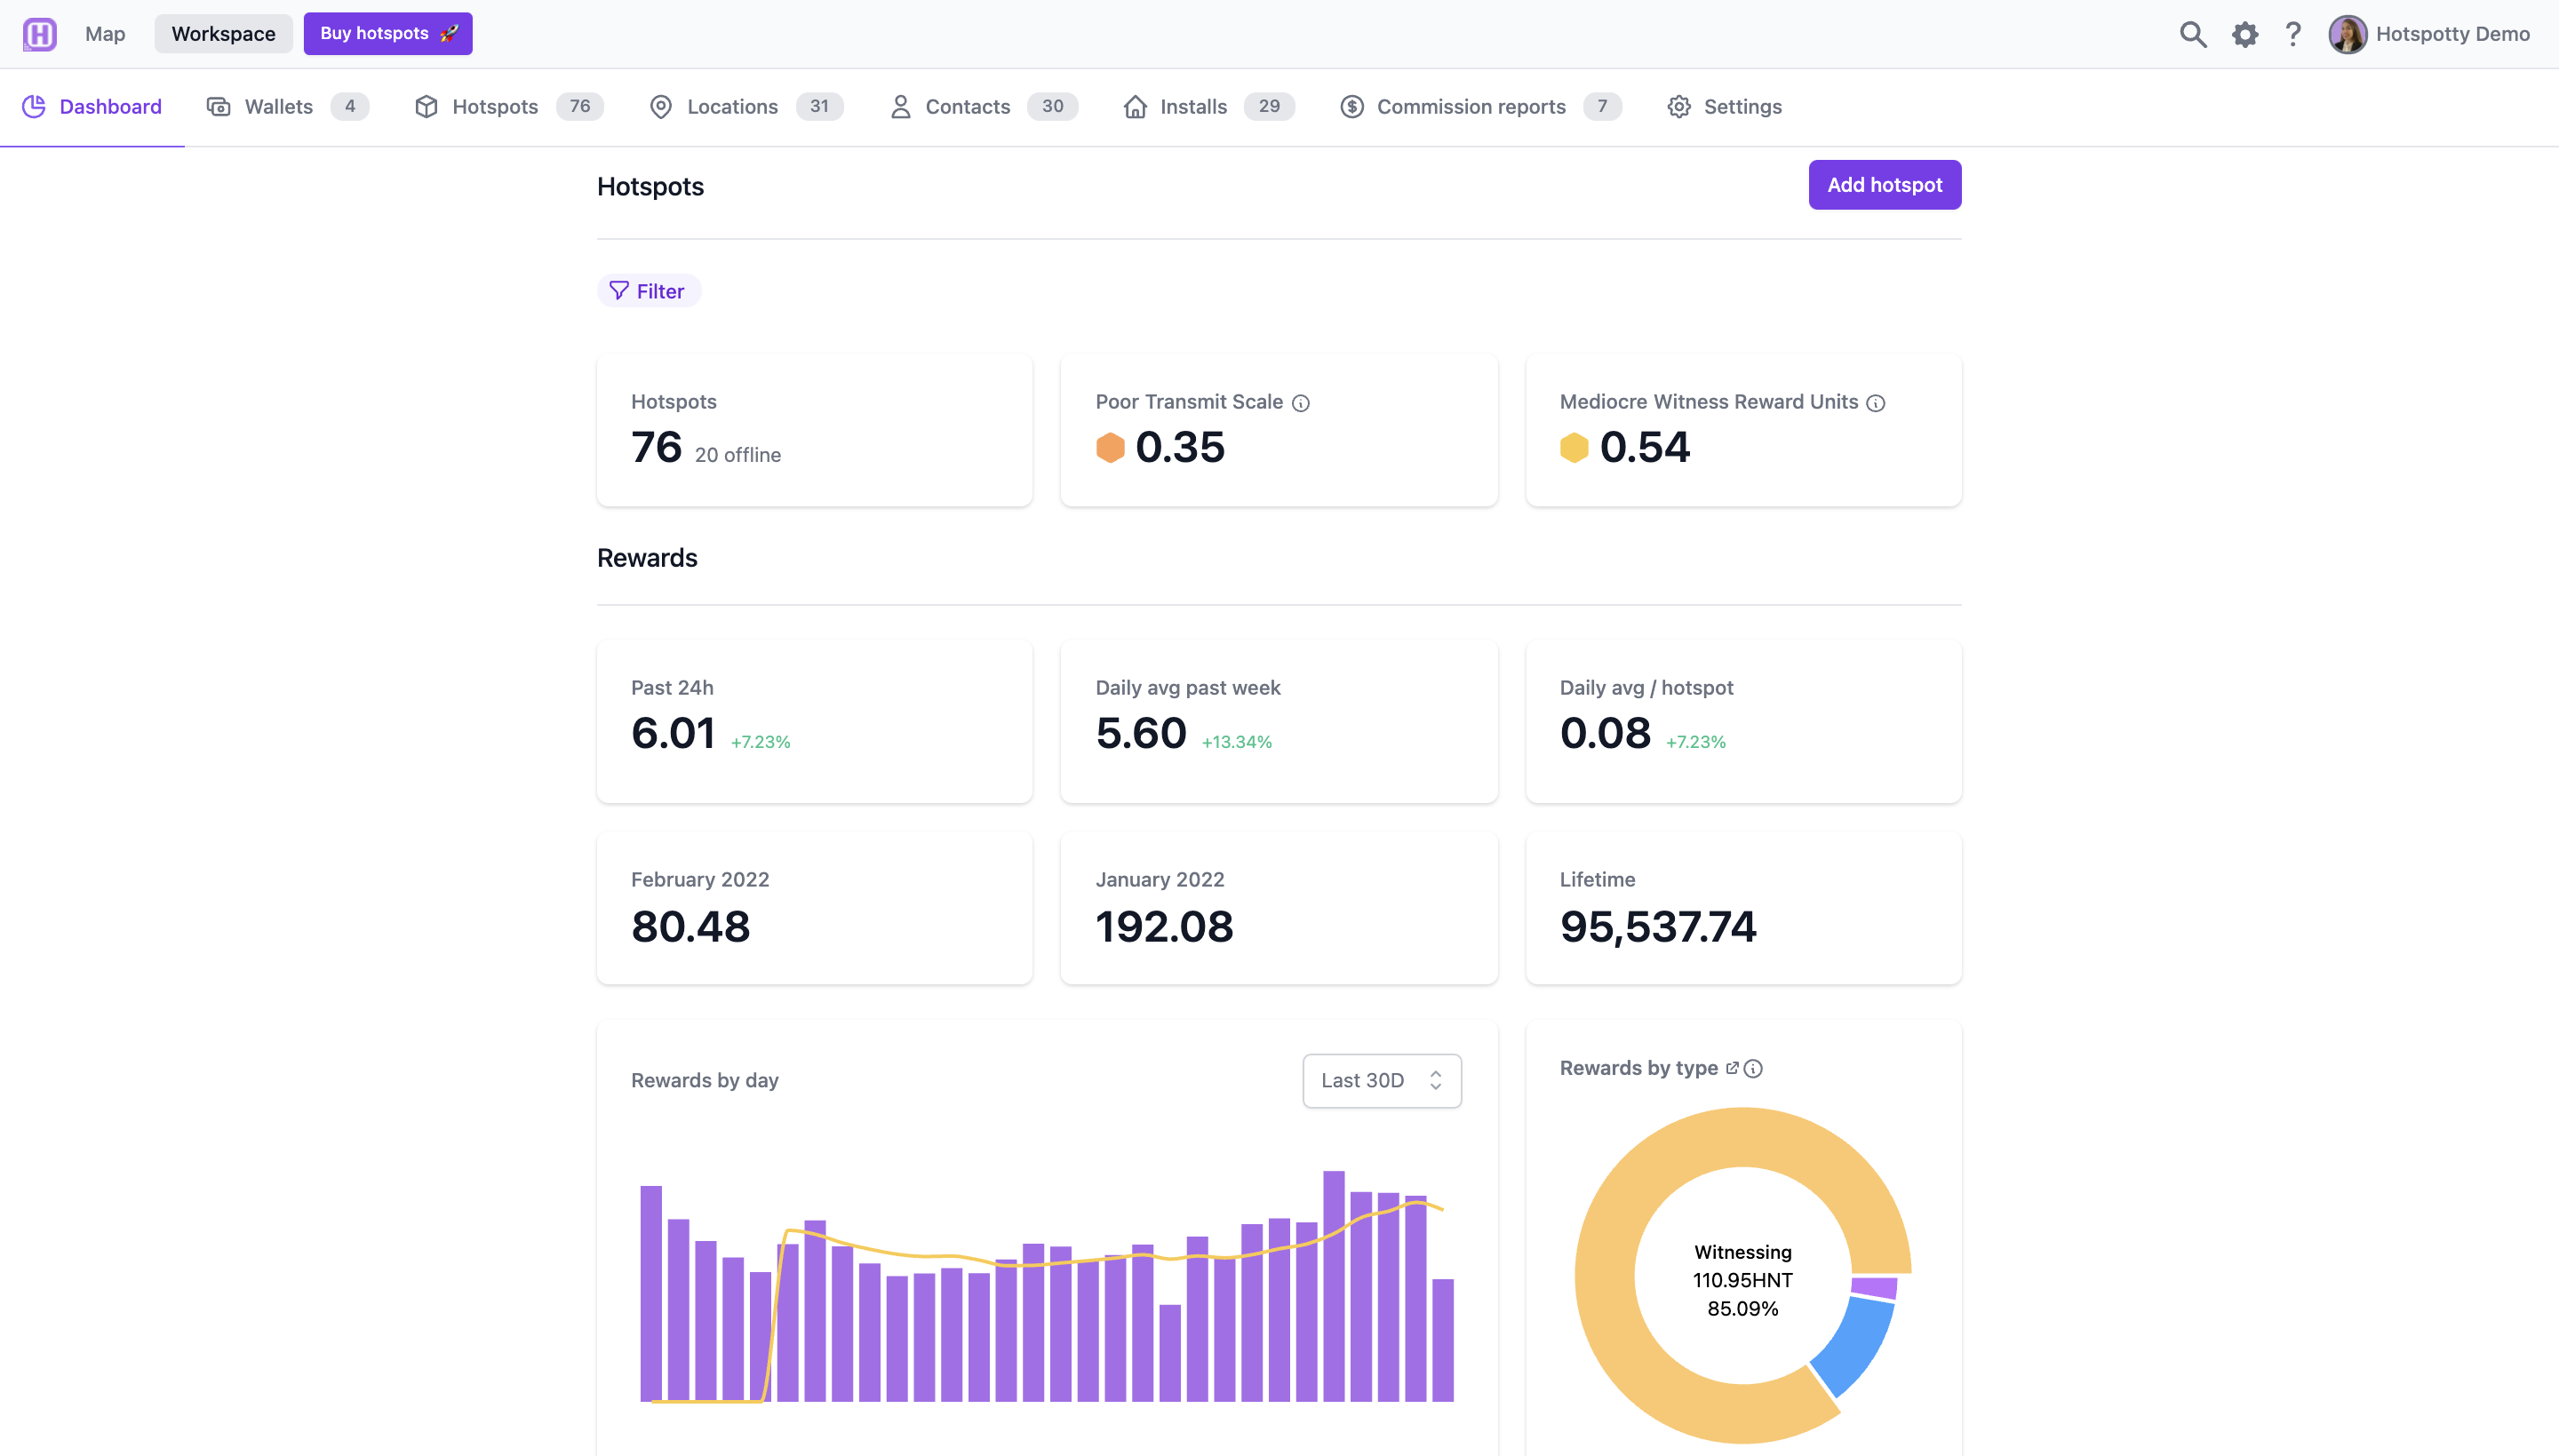
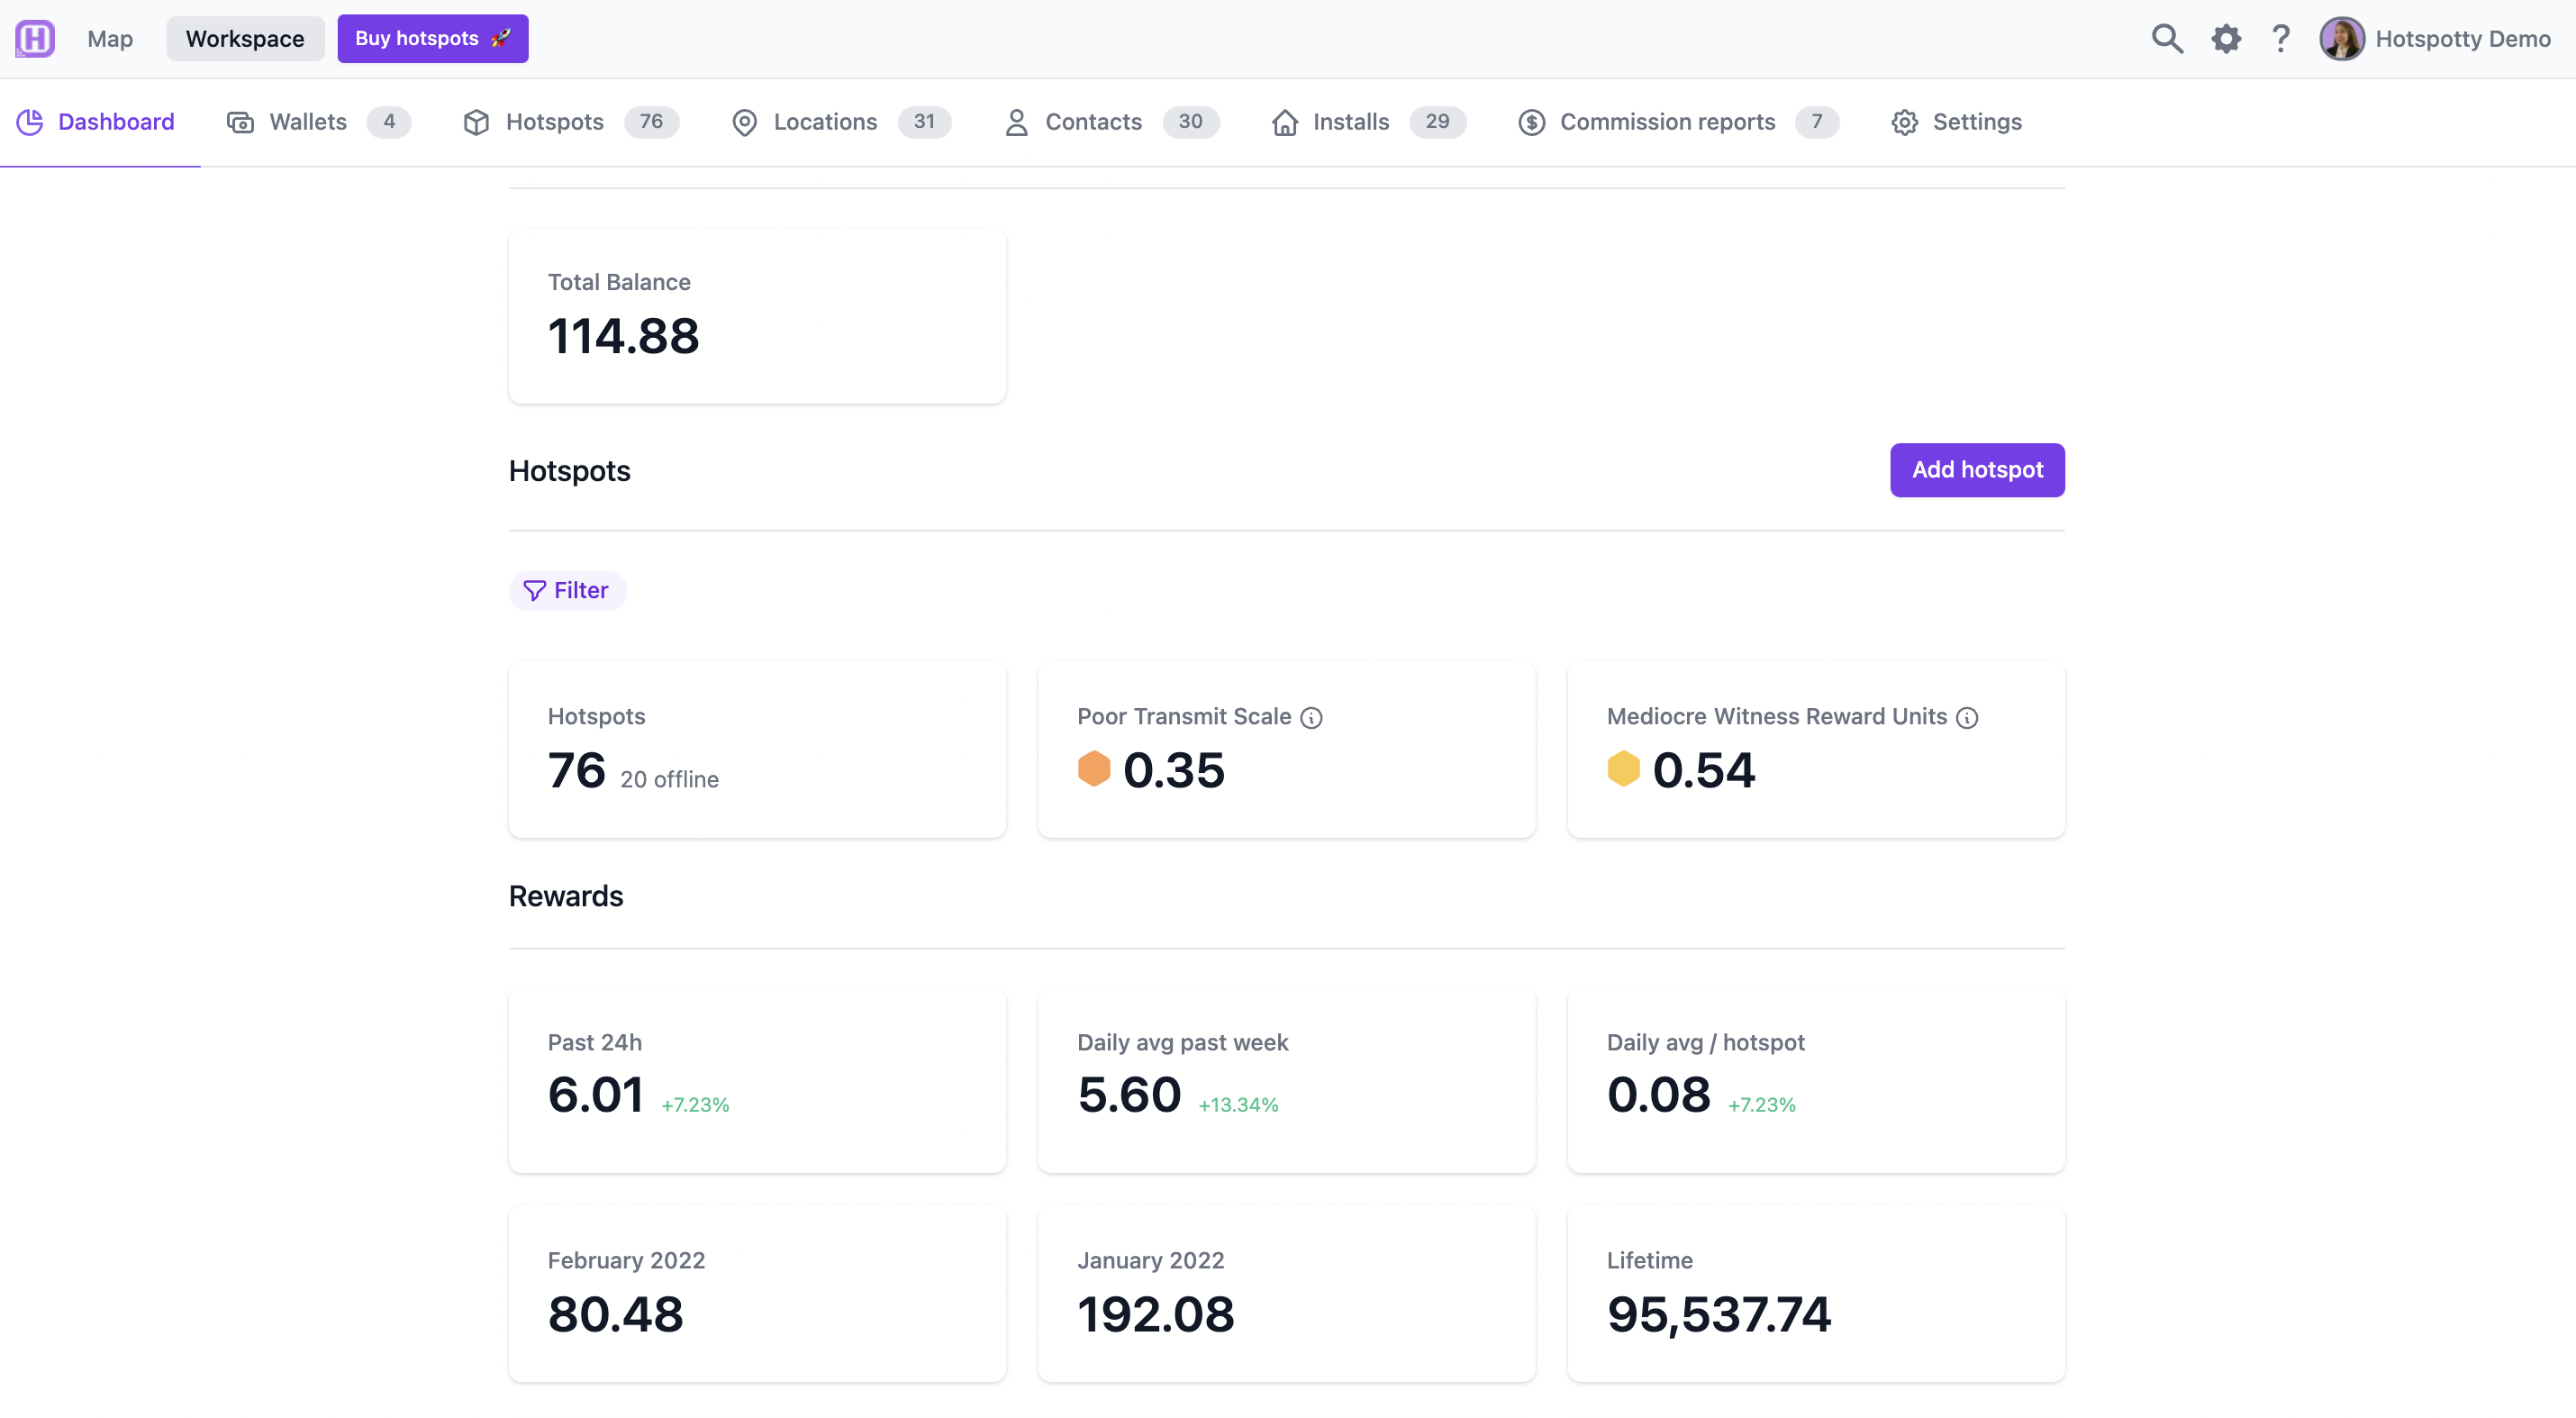
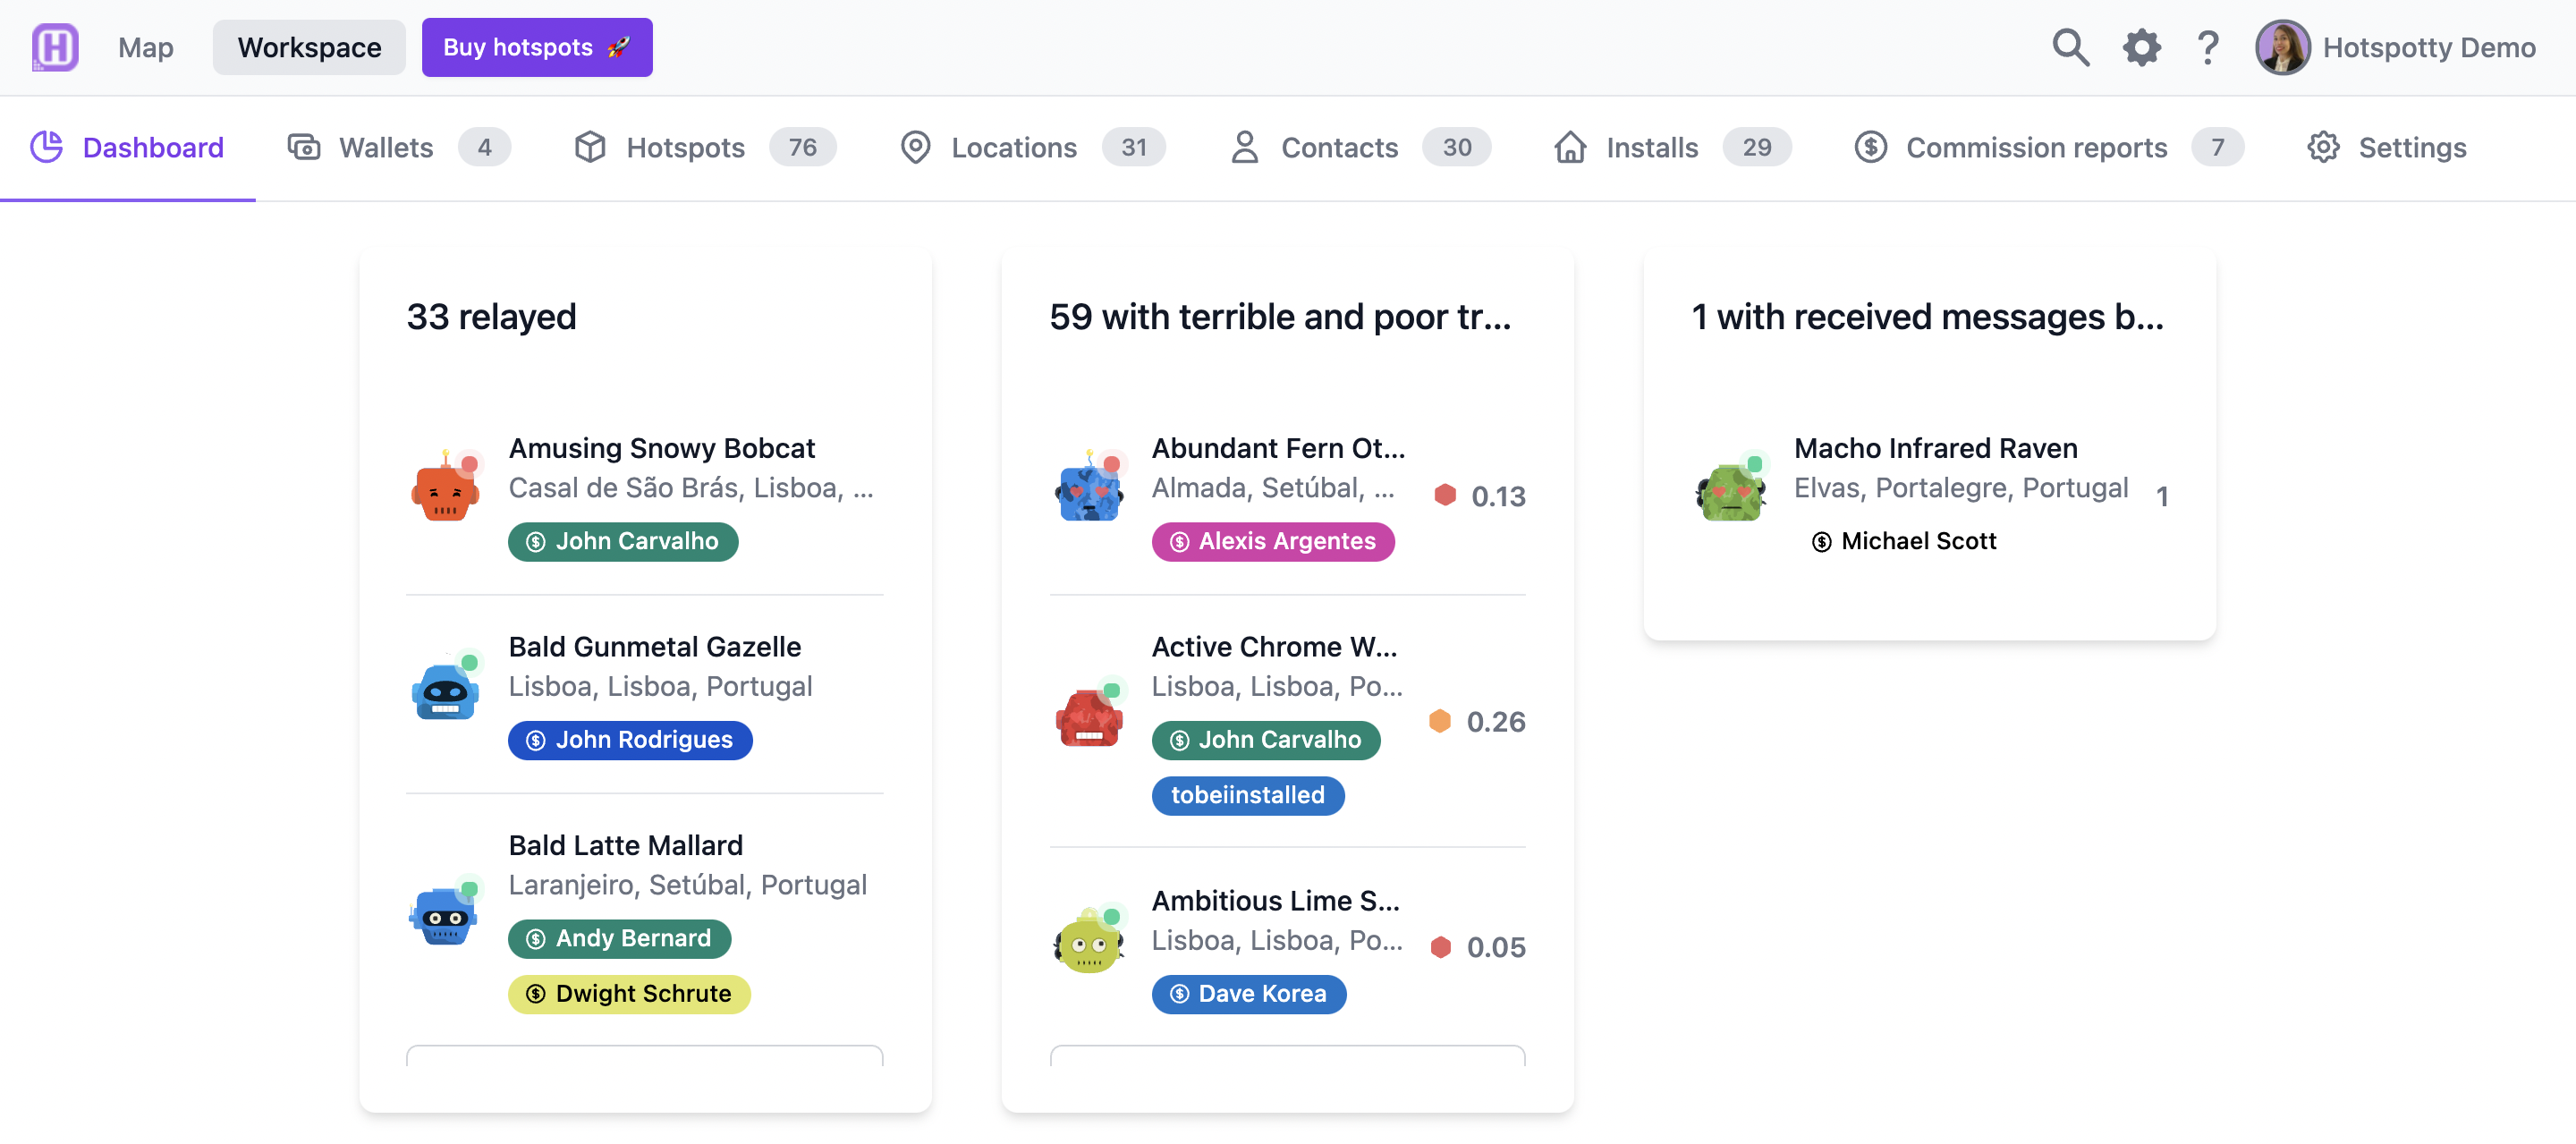
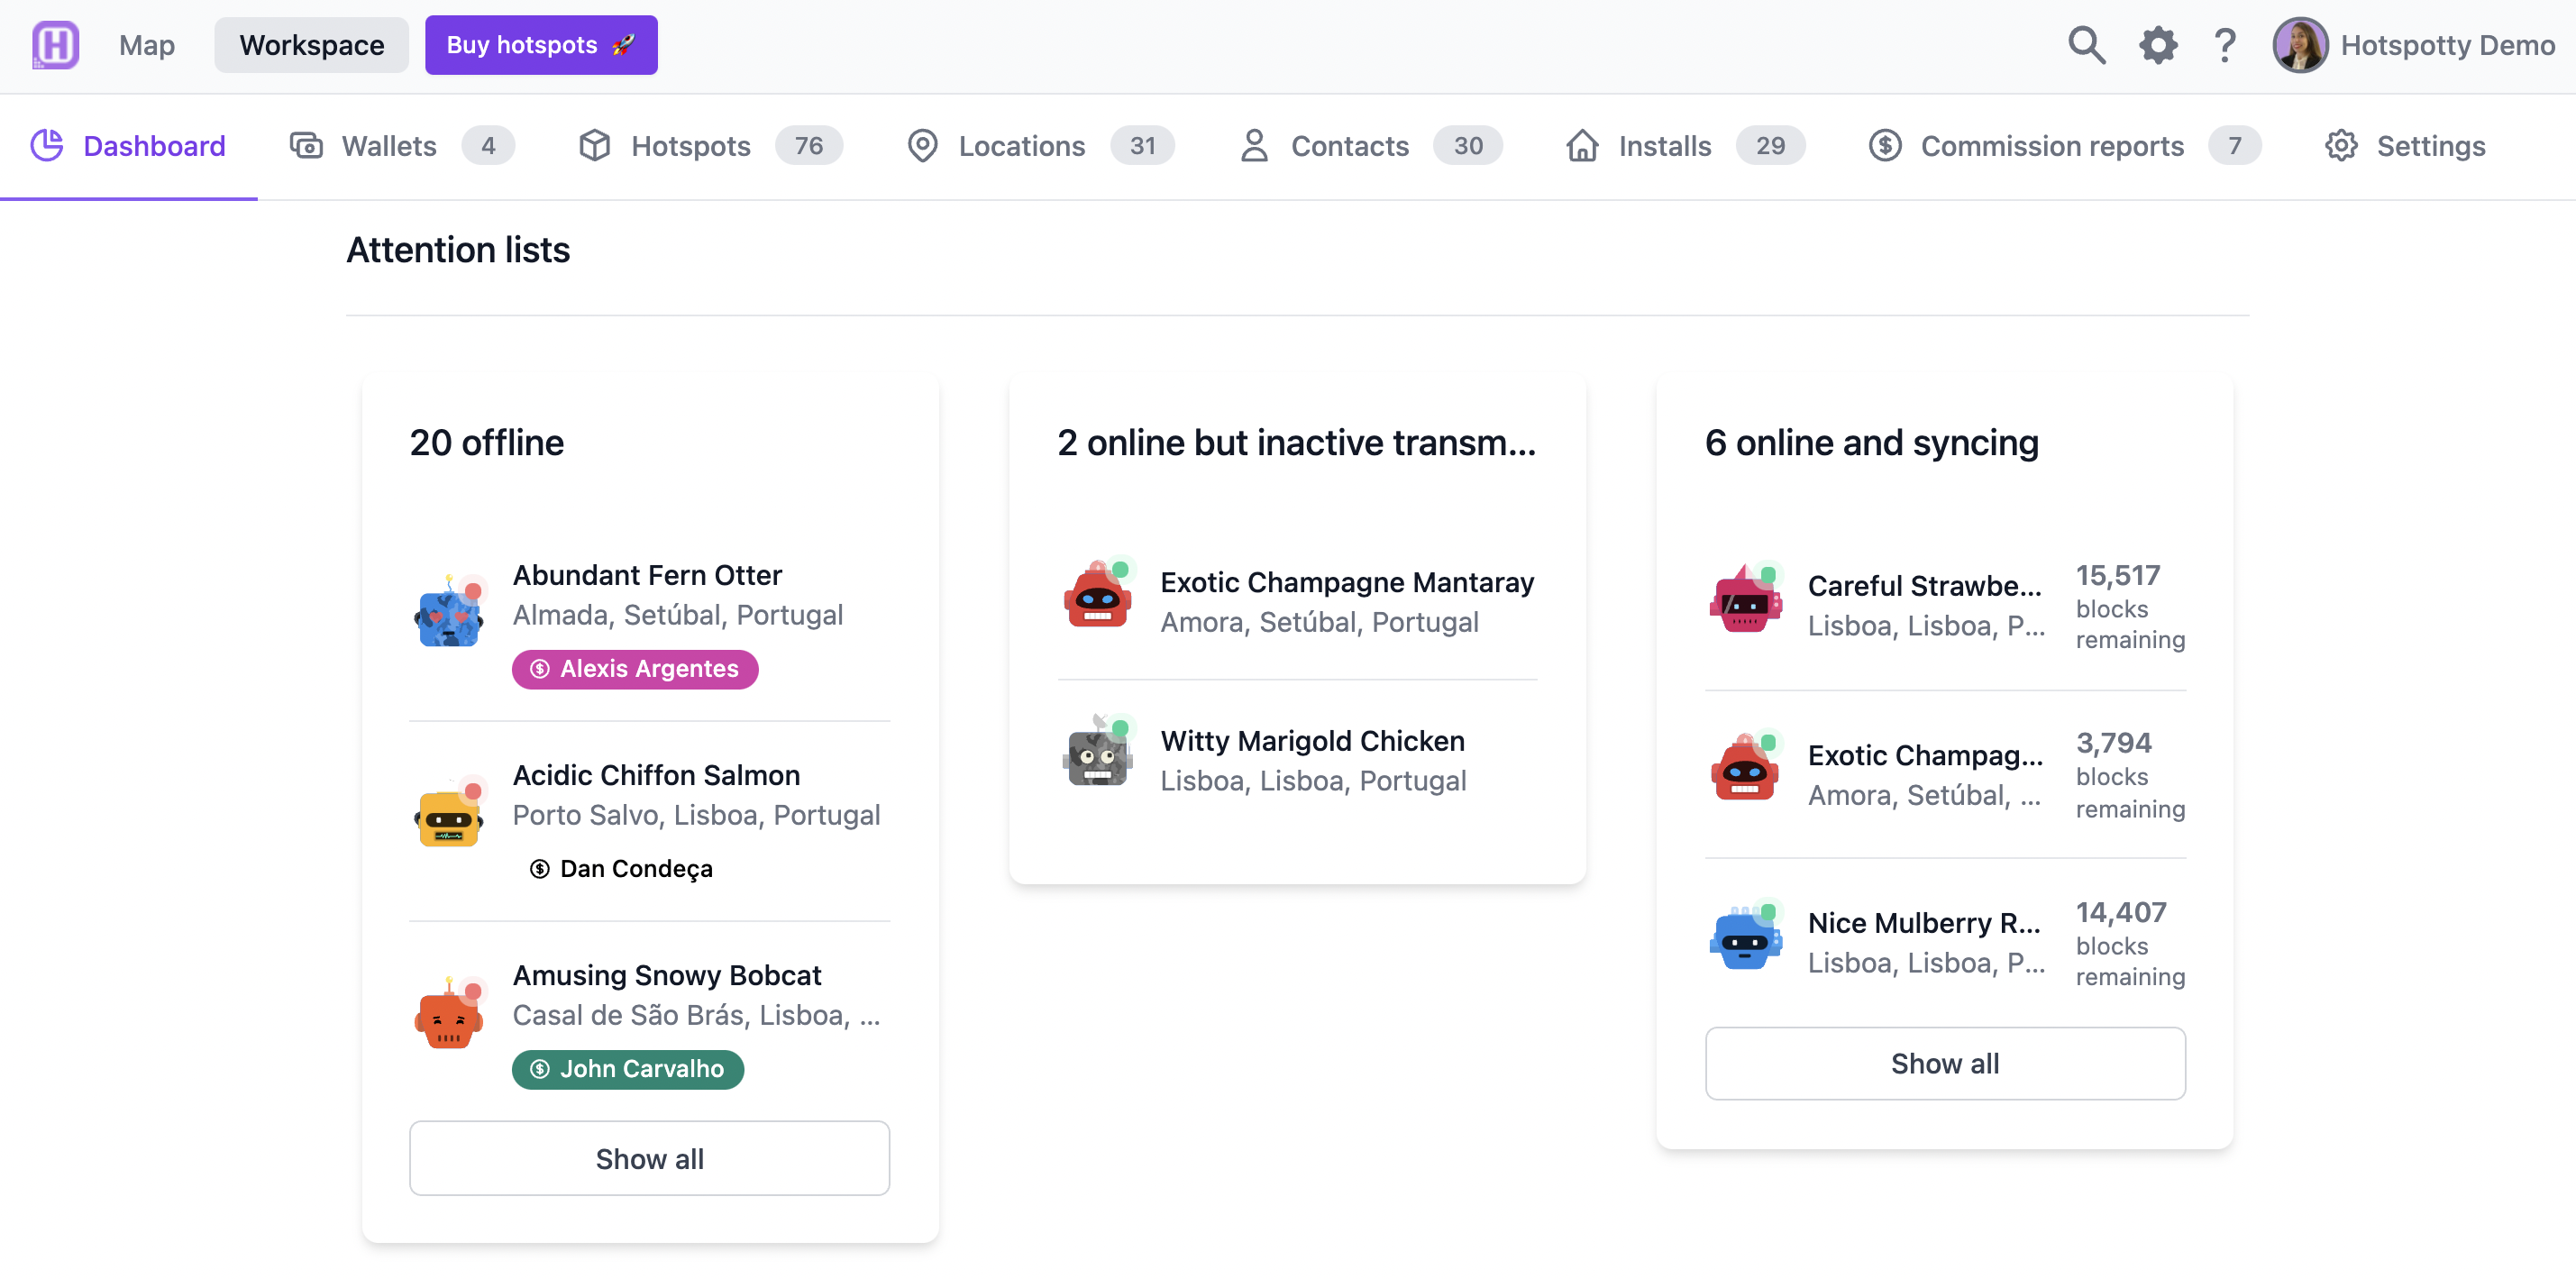
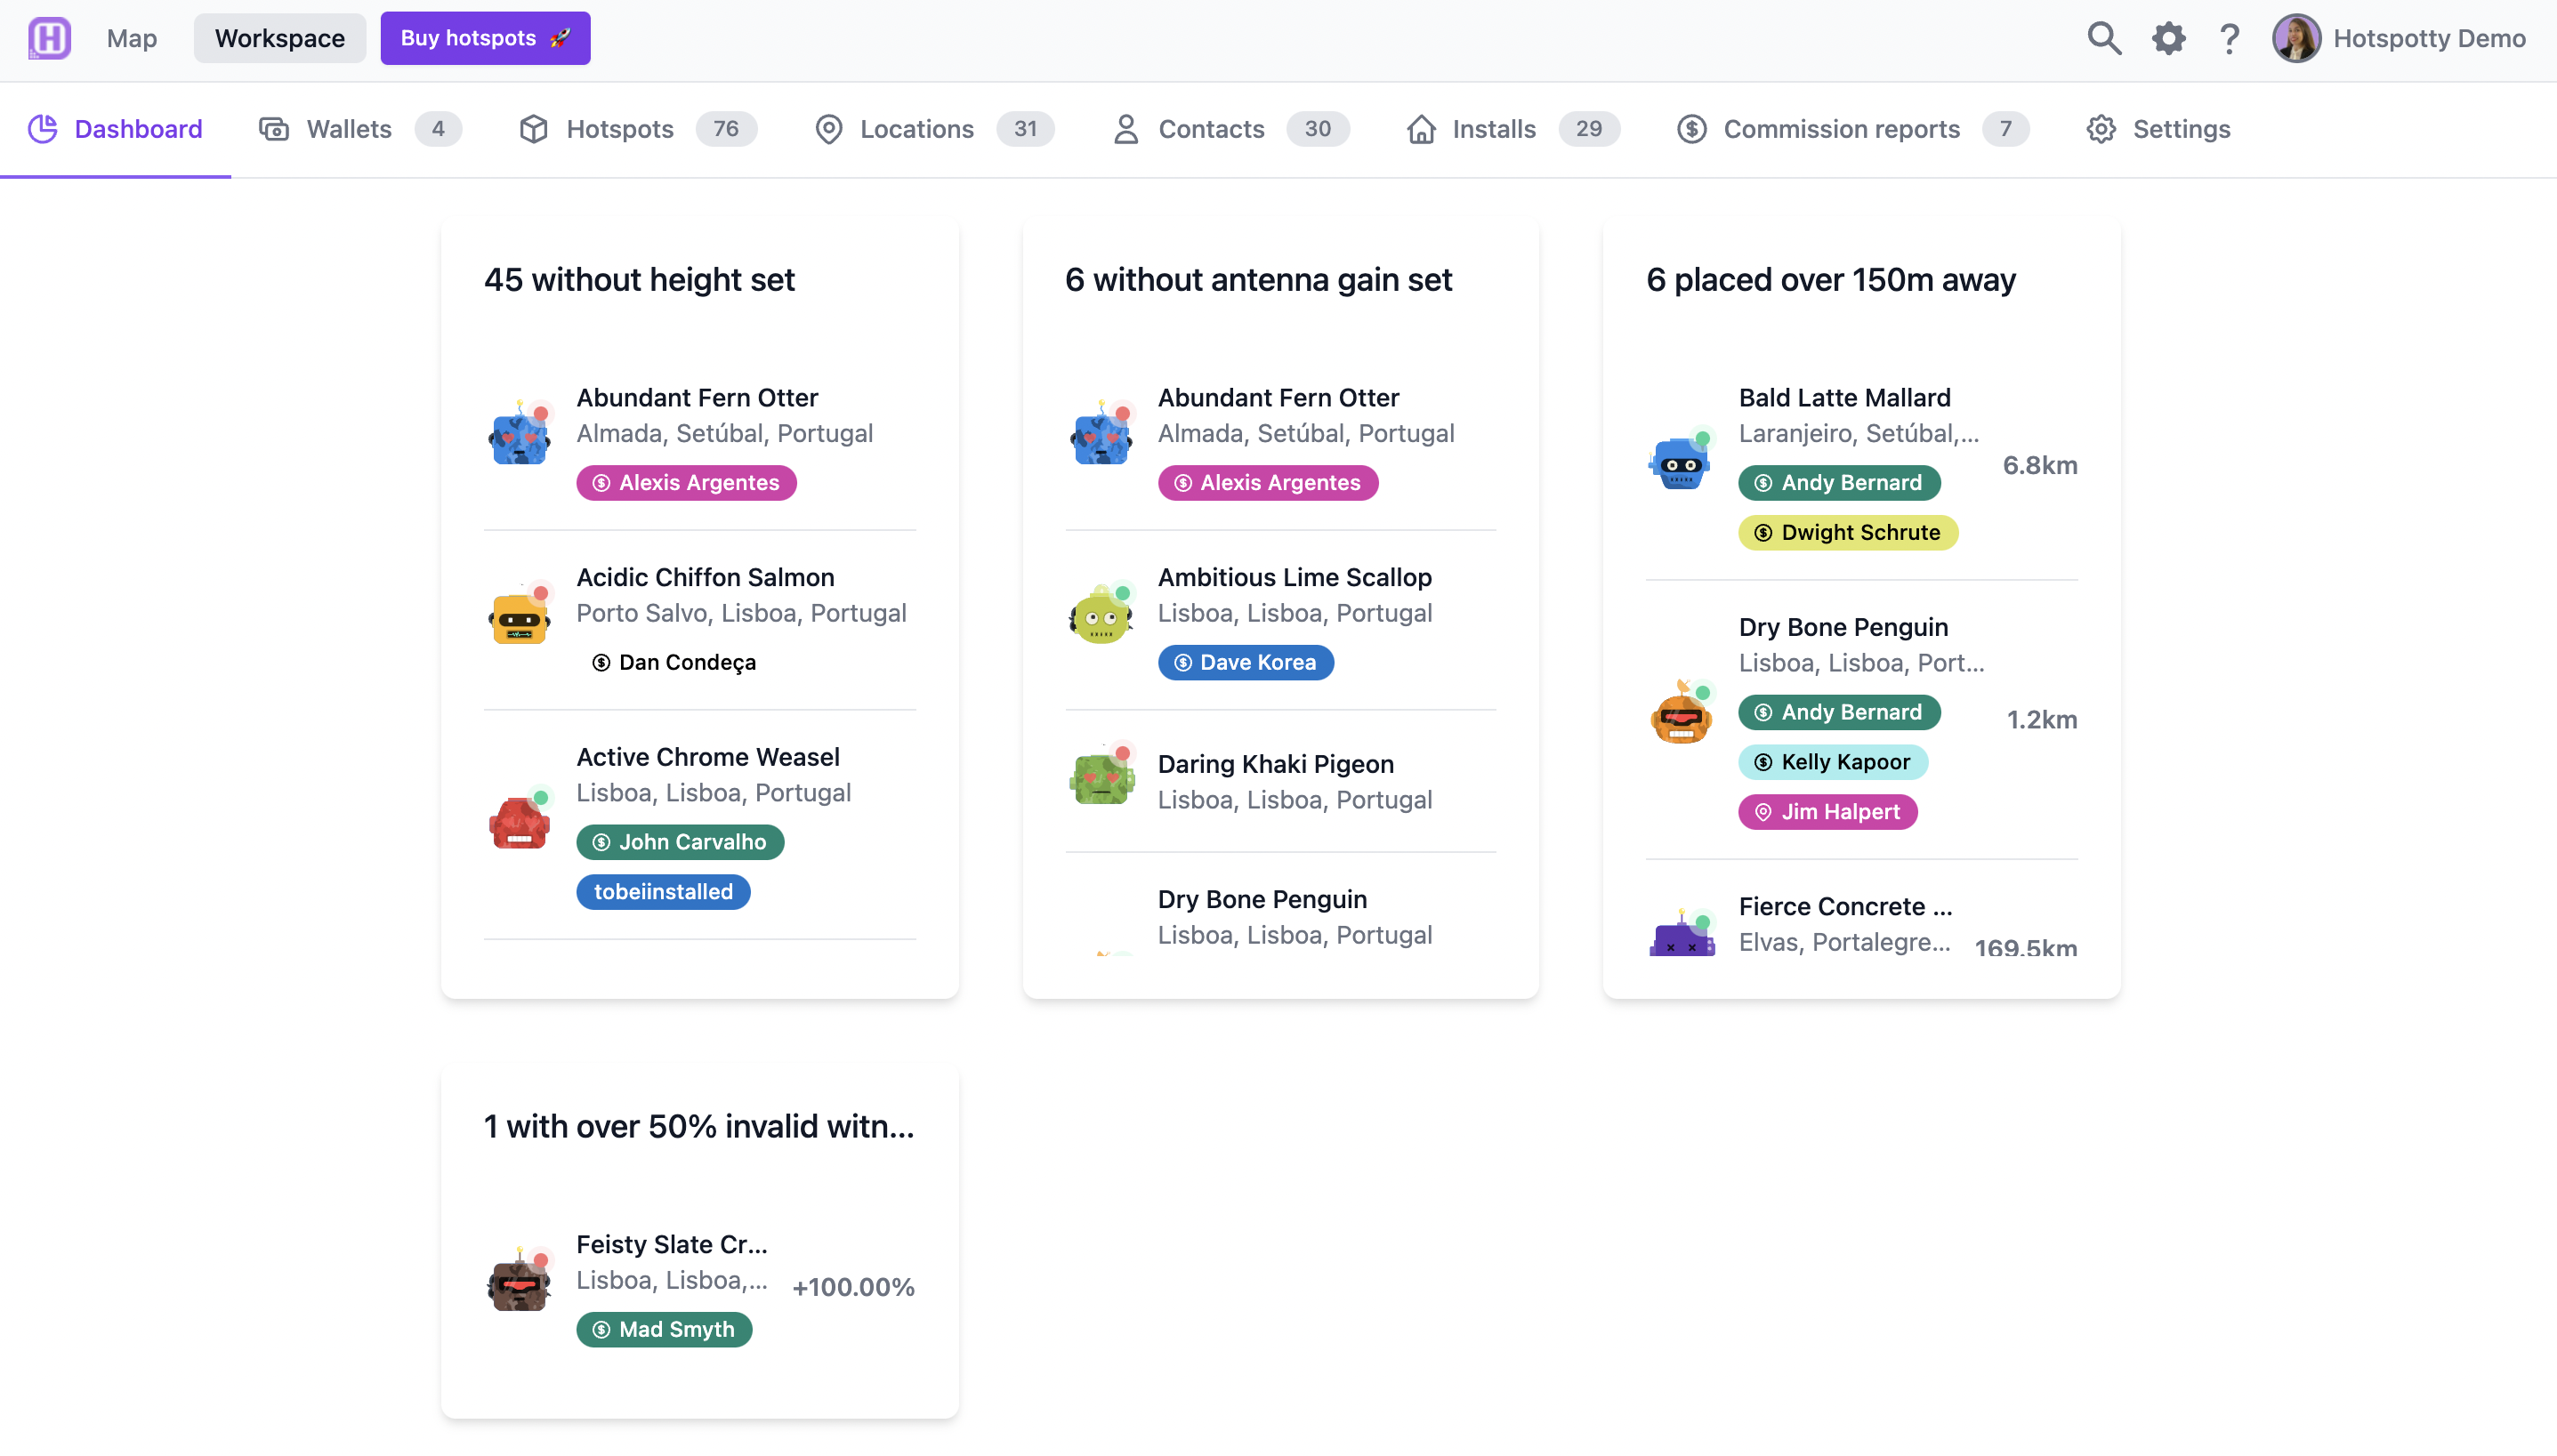
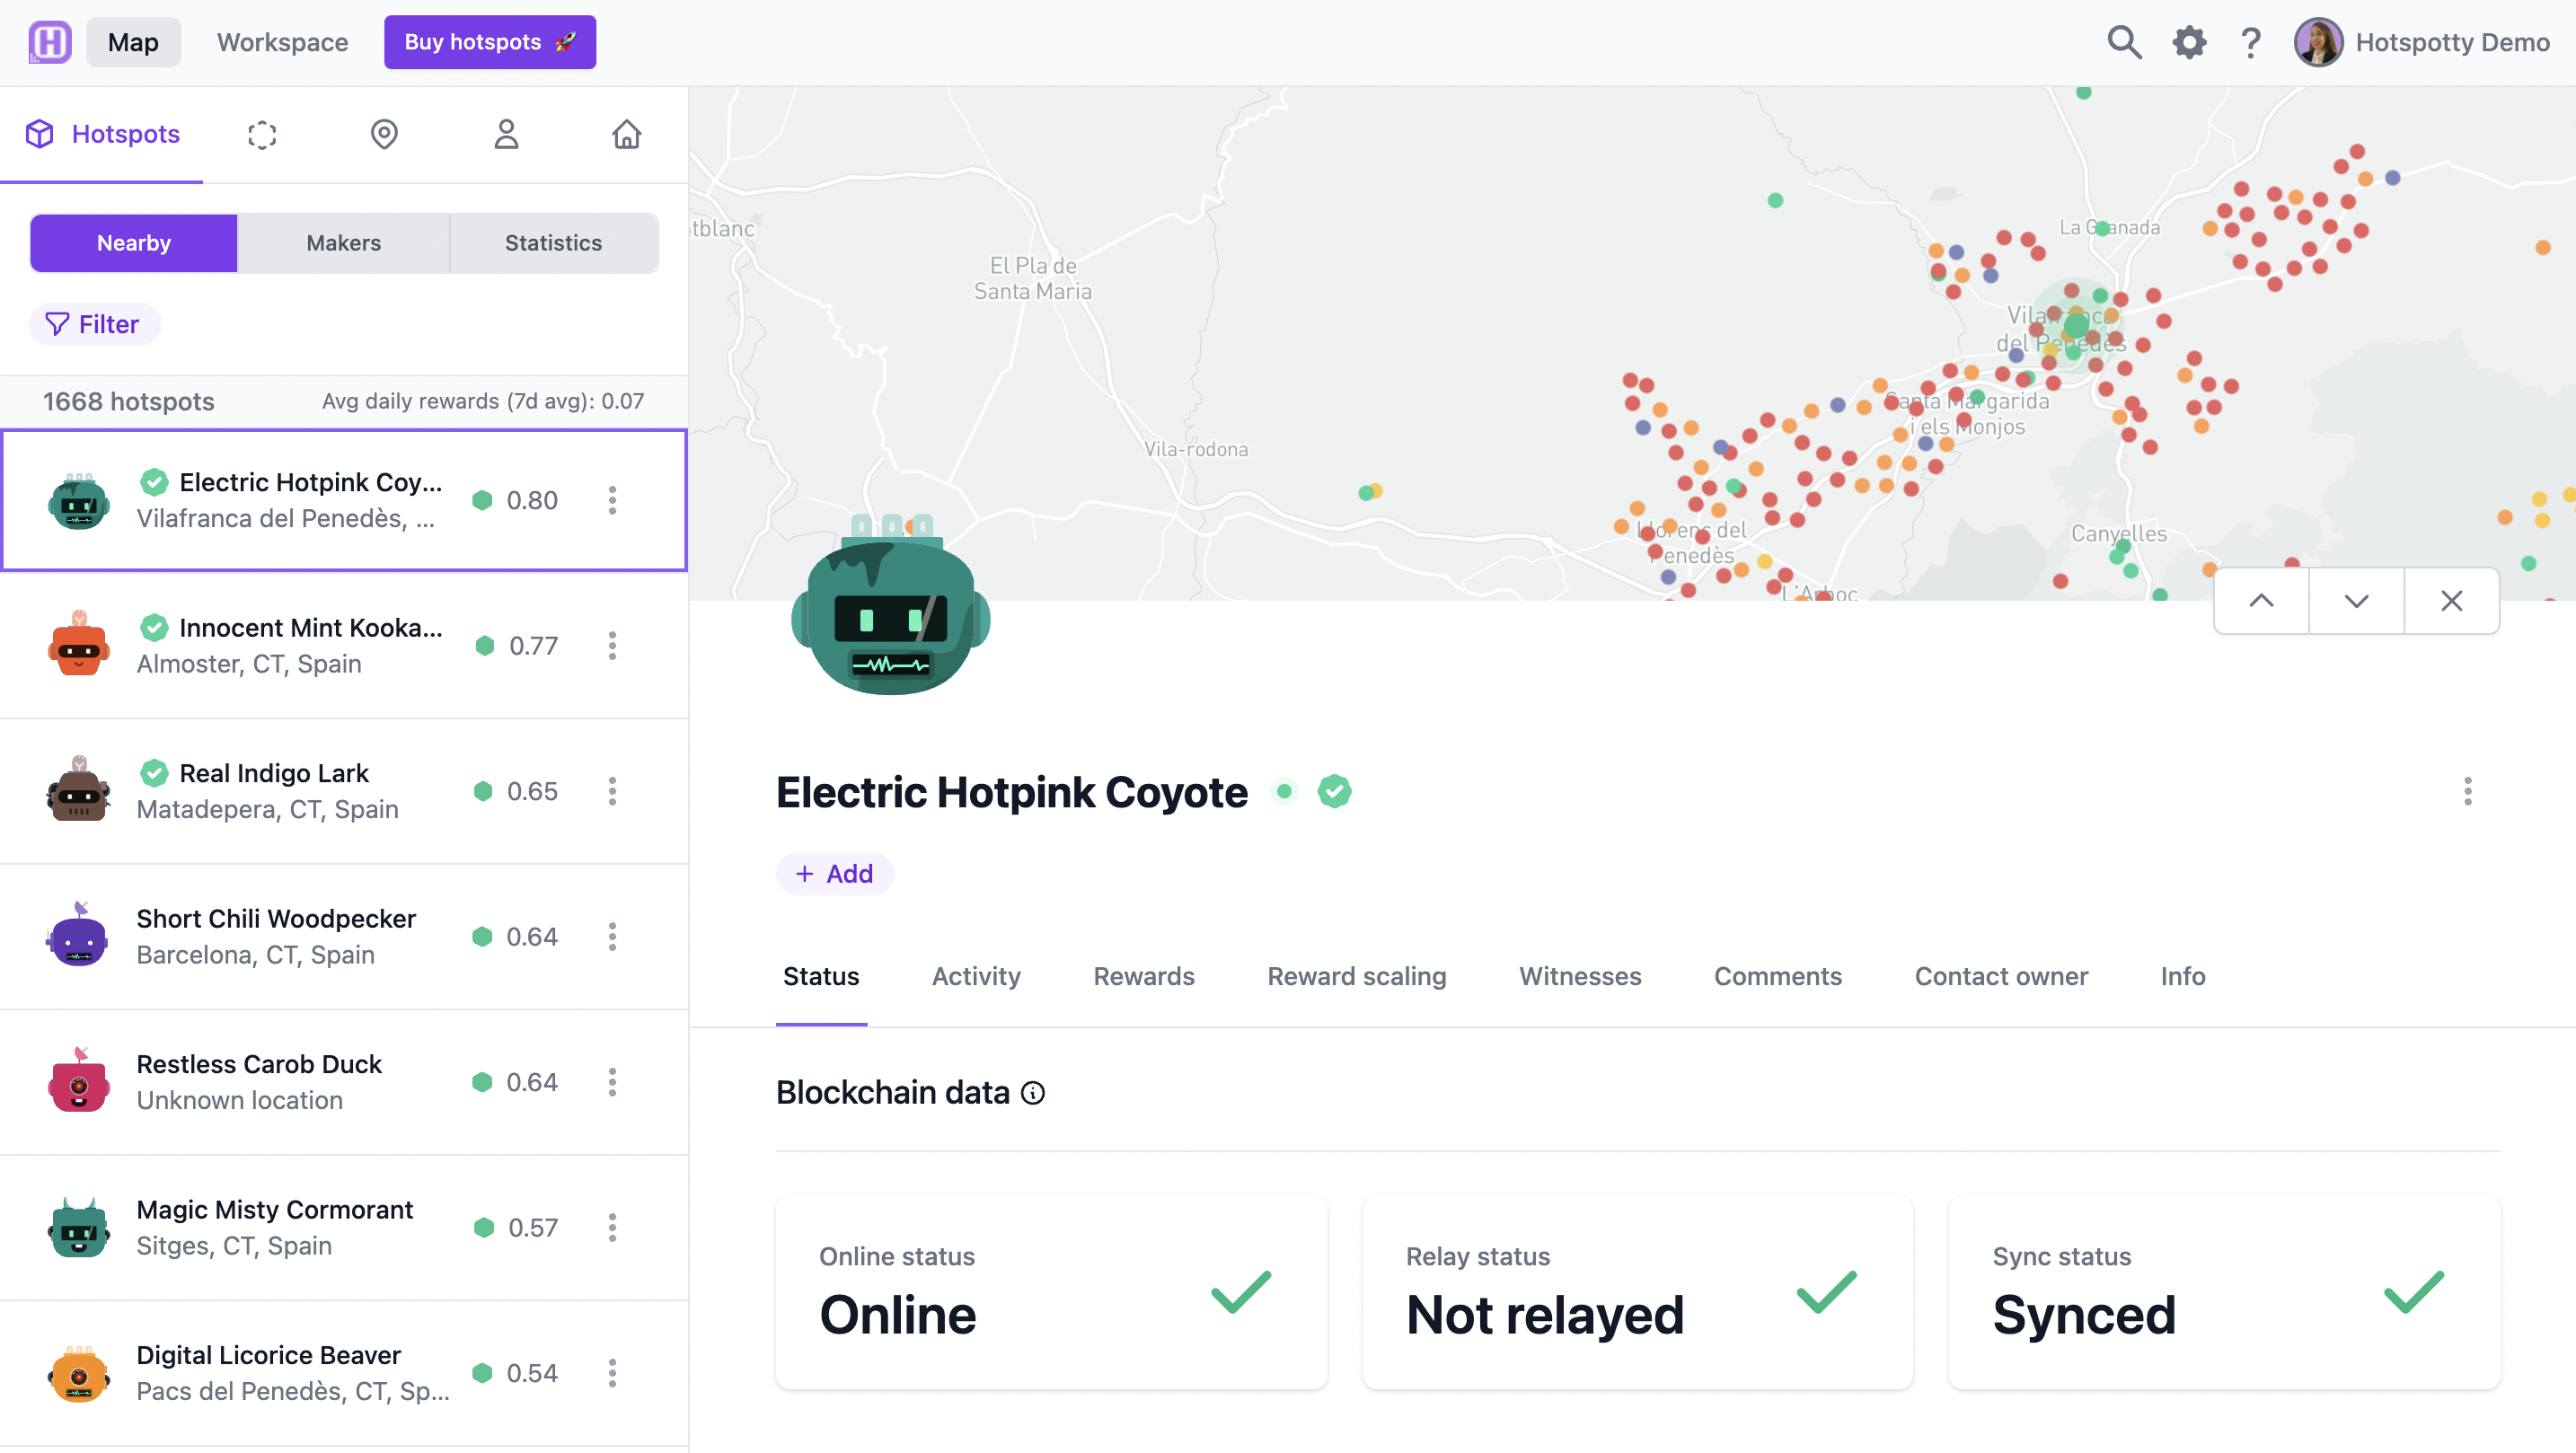
Hotspotty gives you all the information you need to understand when devices might be offline, relayed or why they are suffering from reward scale reductions.

Deep dive into individual hotspot performance

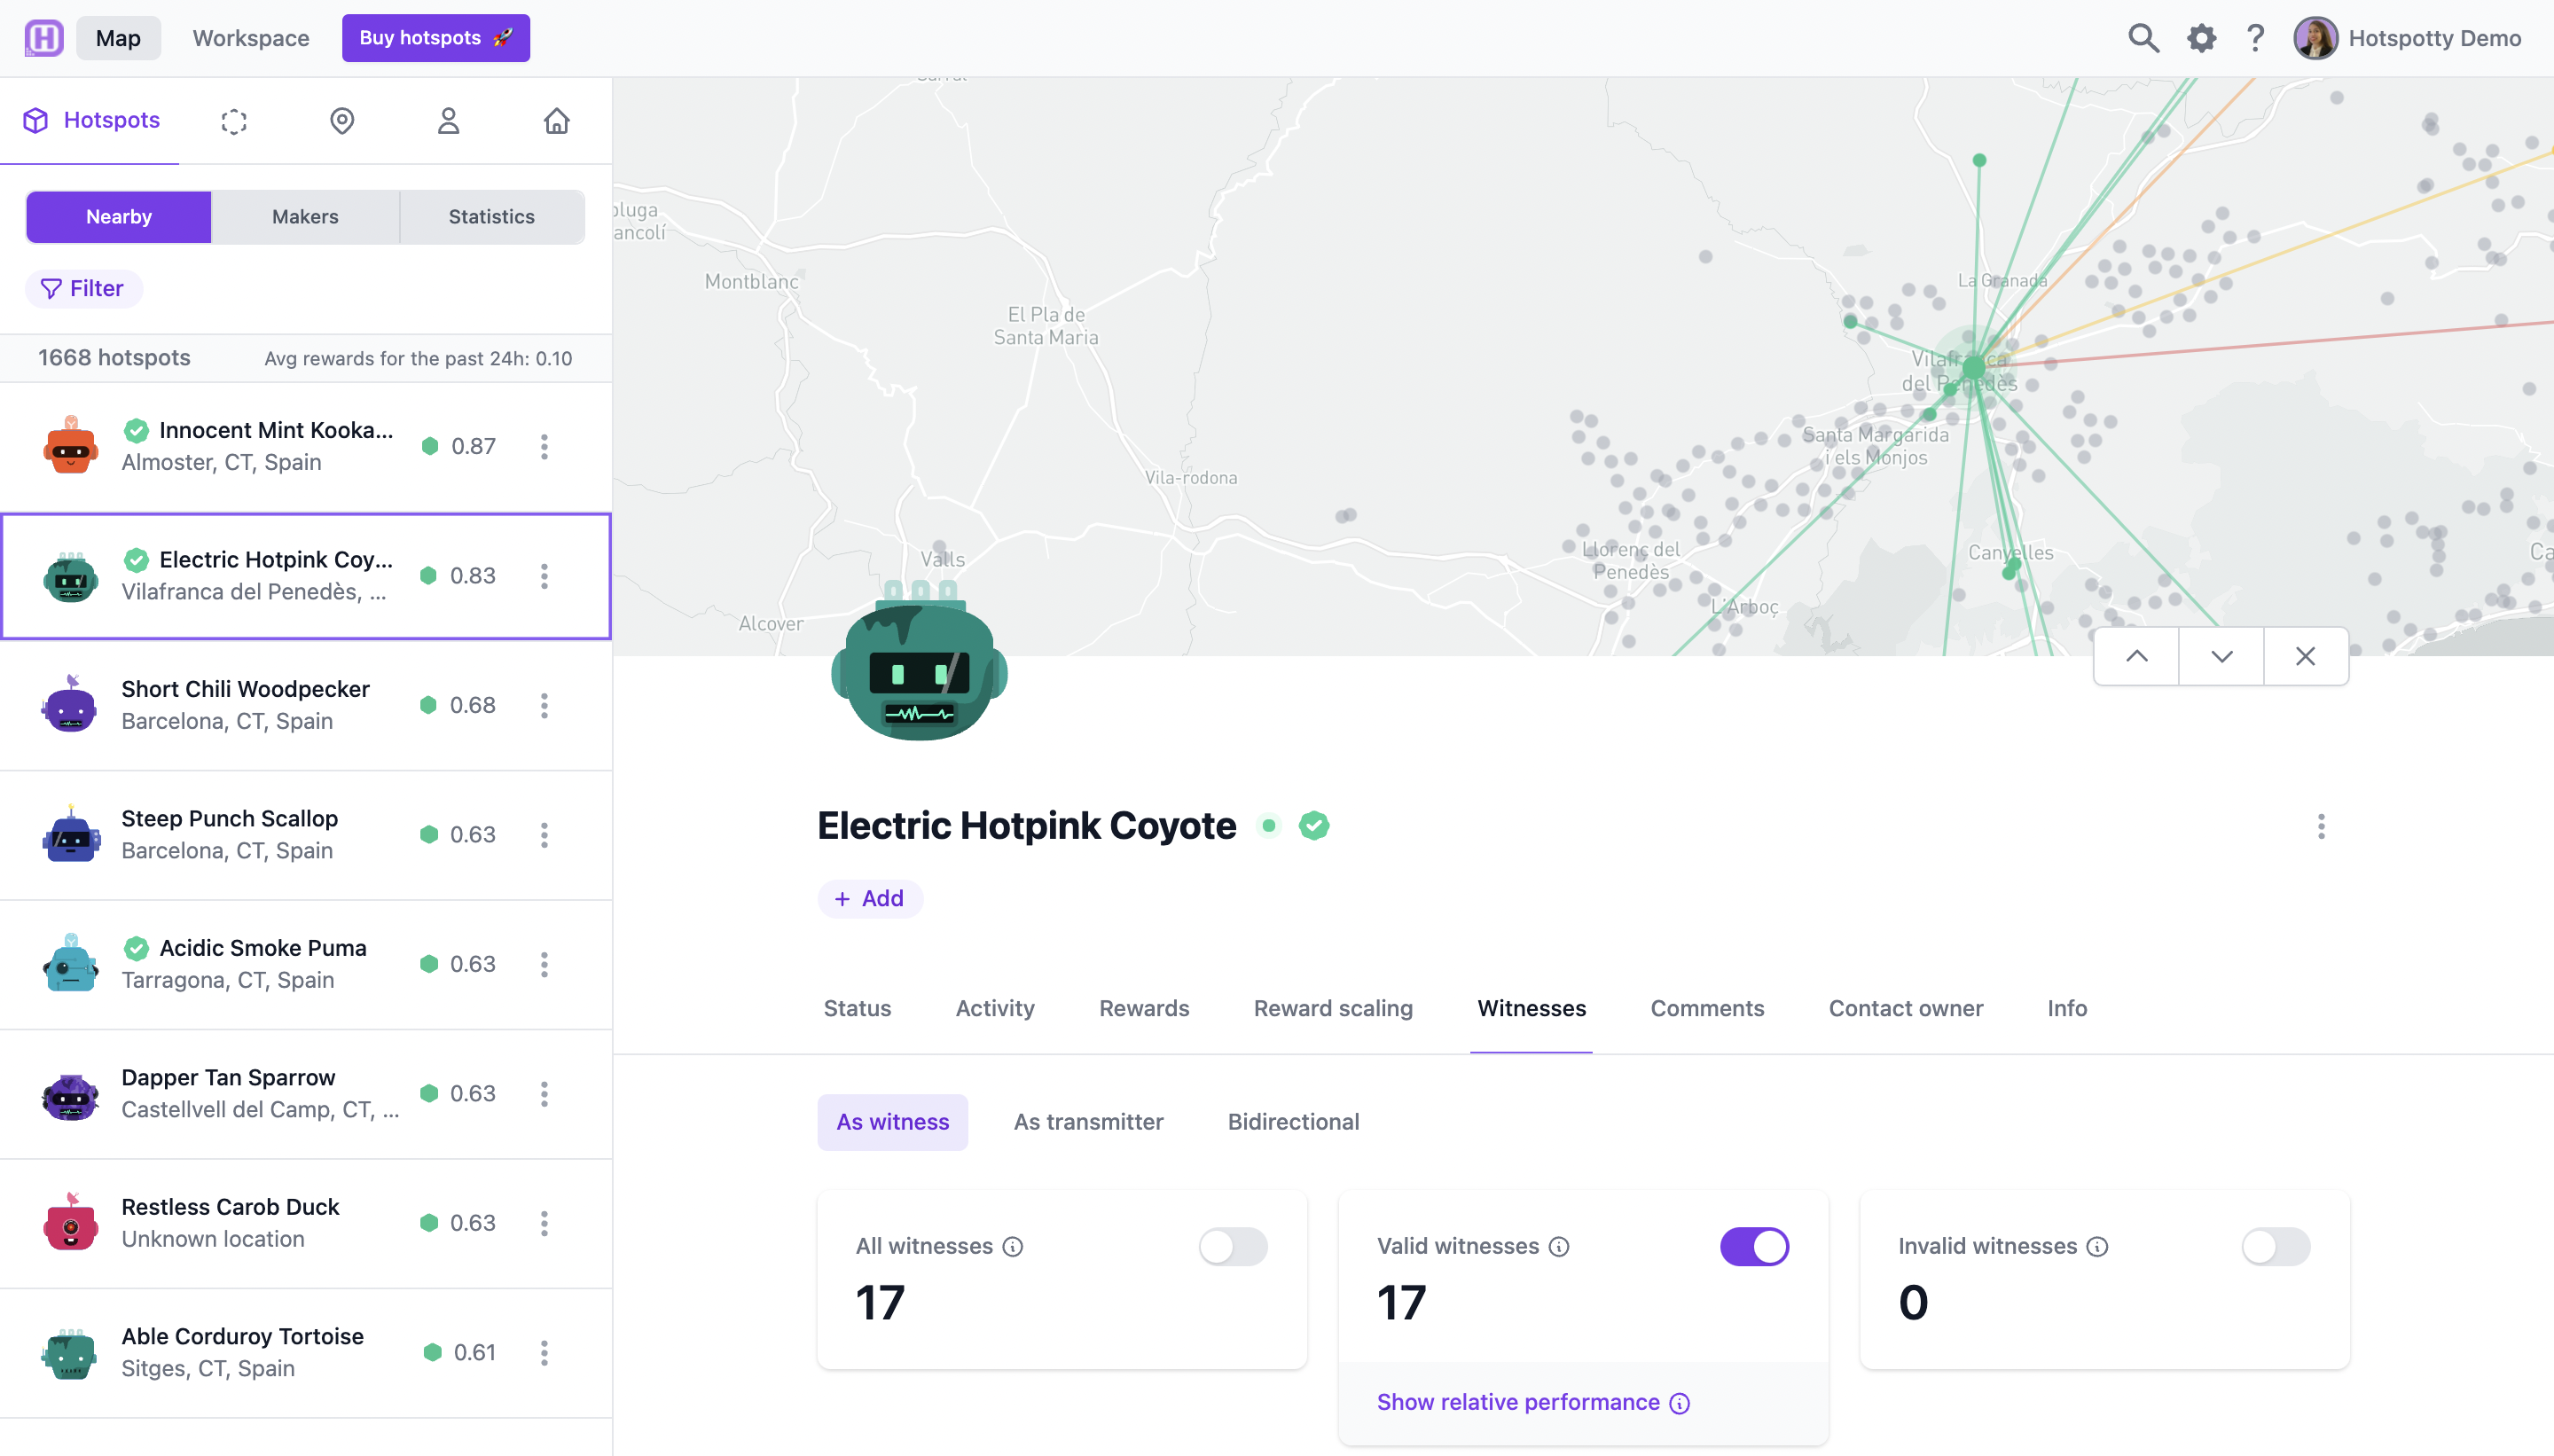
The advanced hotspot overview helps you deep dive into individual hotspot status and data to understand how and why they are performing, in terms of all potential rewards, beacons and witnesses. Now you can tell precisely what’s driving or penalizing your reward scale.

Clearer, easier to use mapping tools

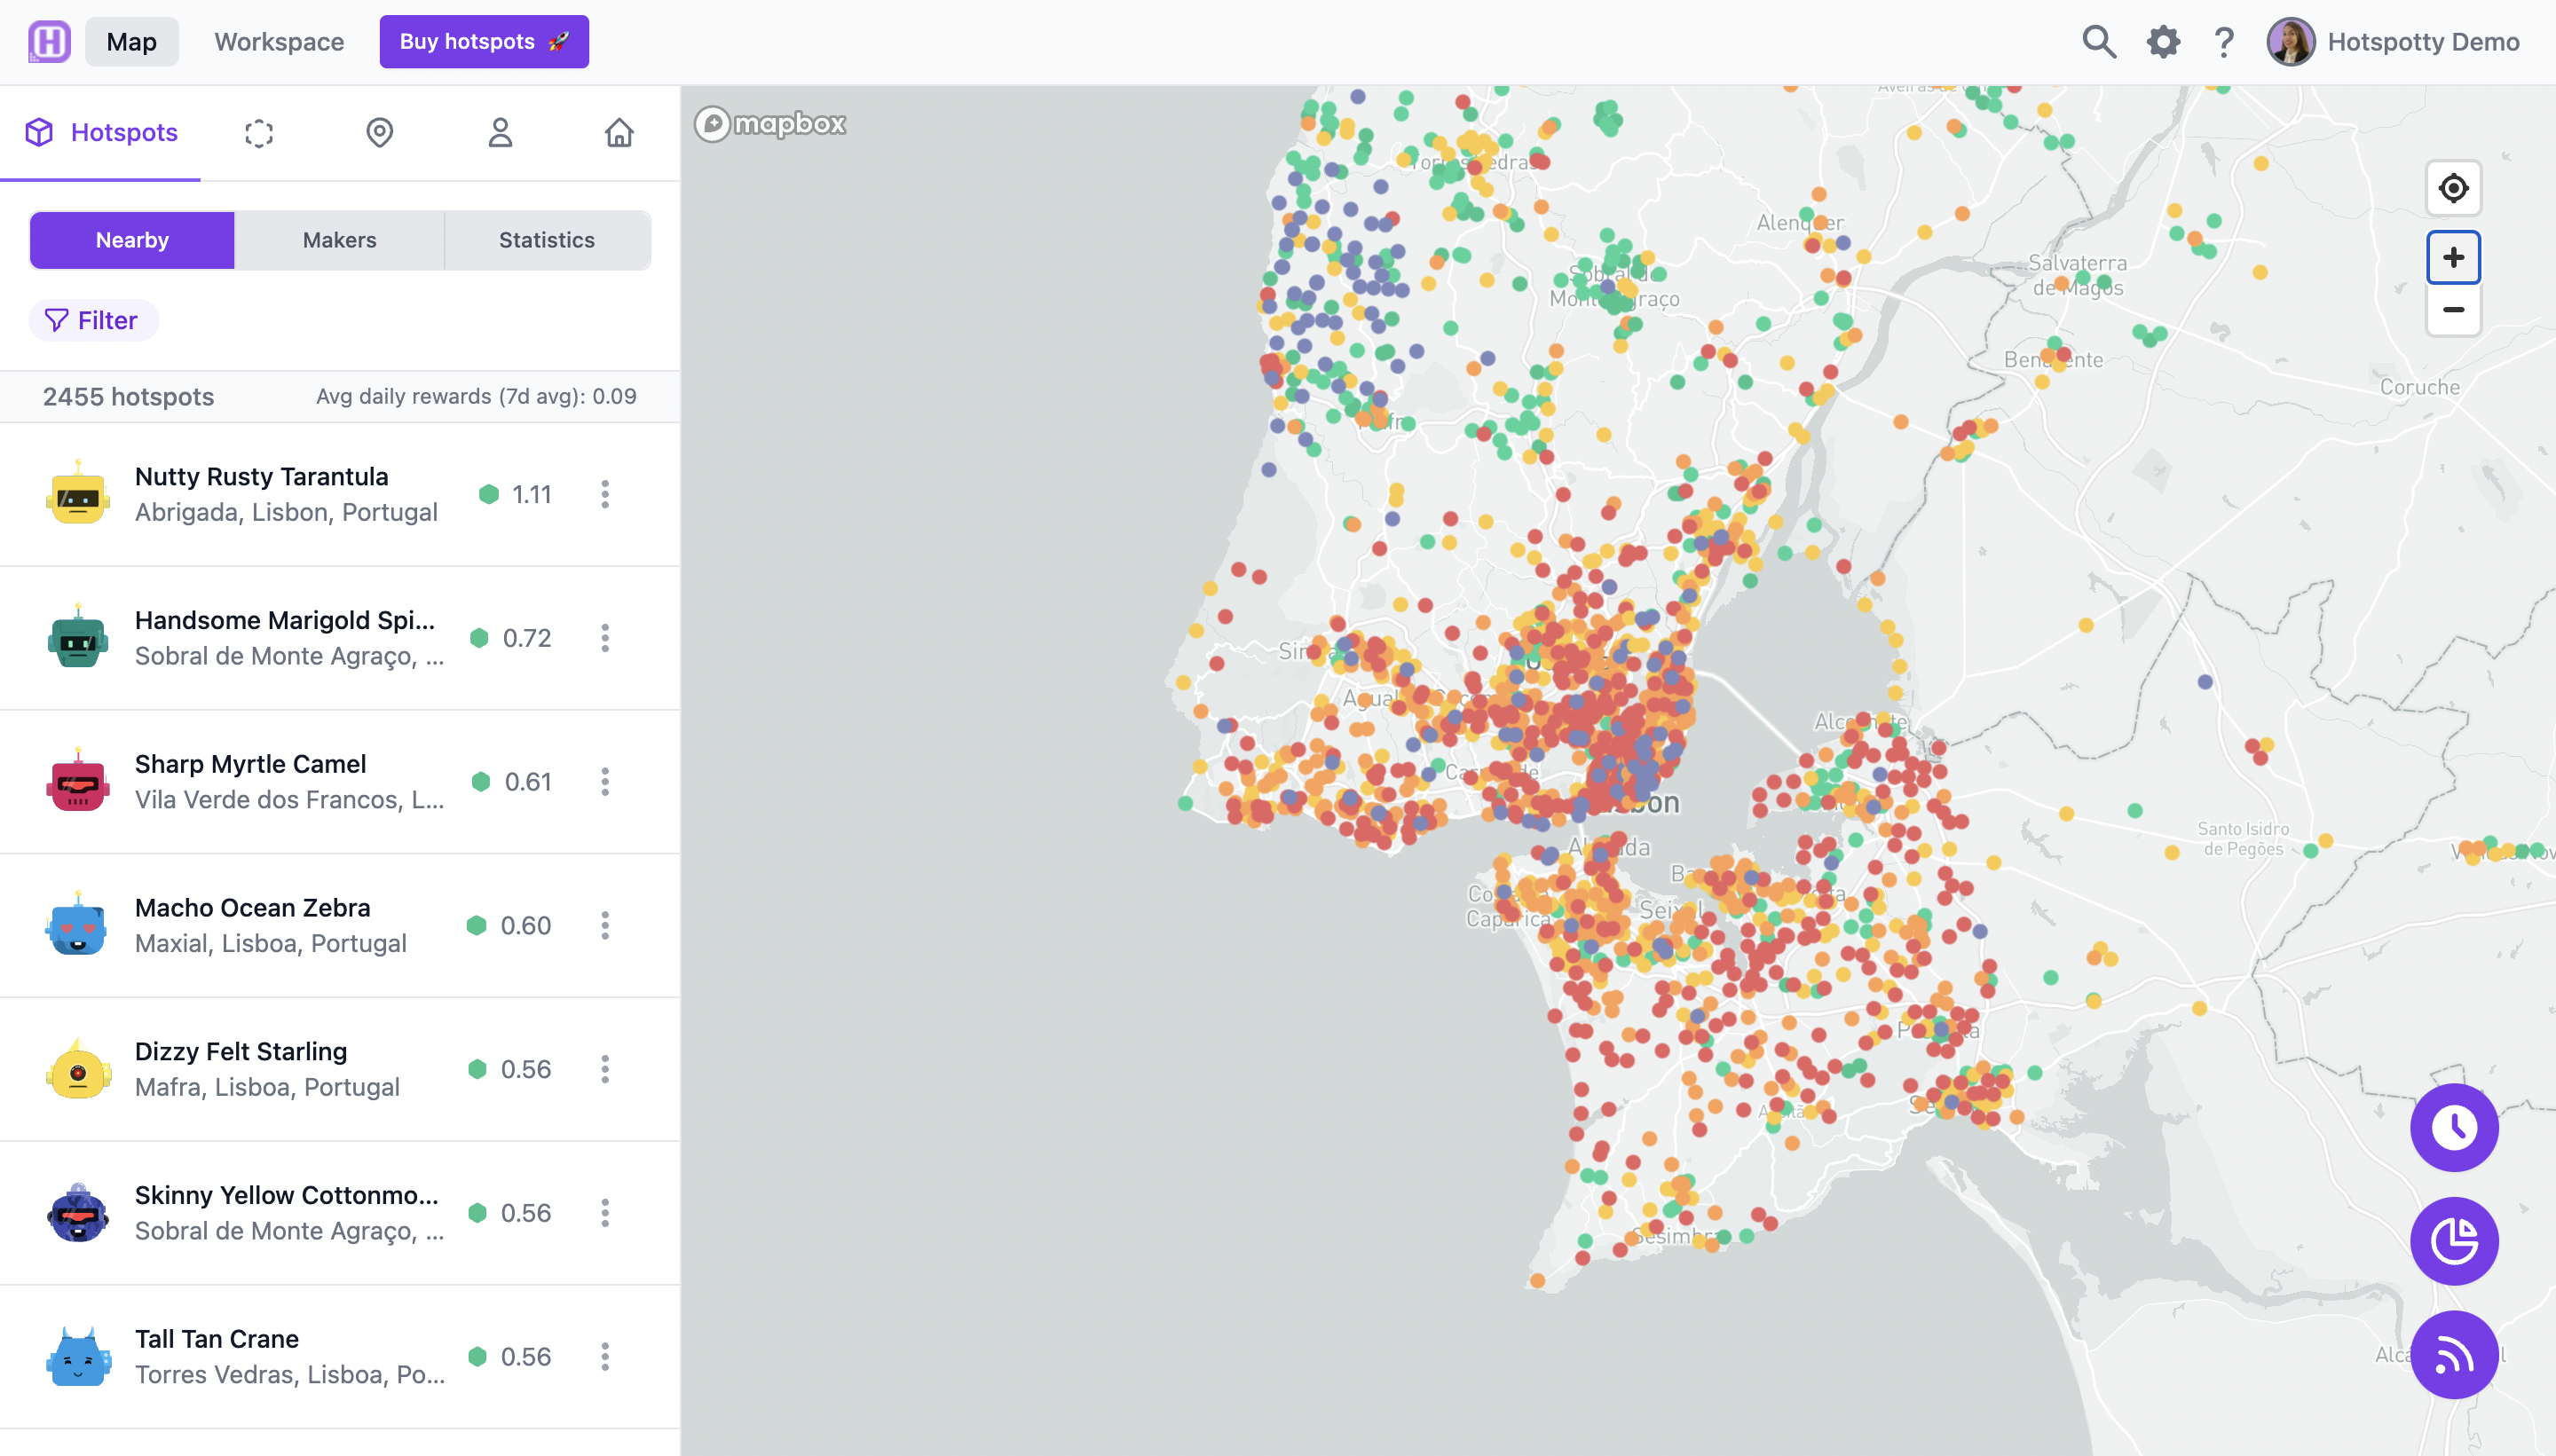
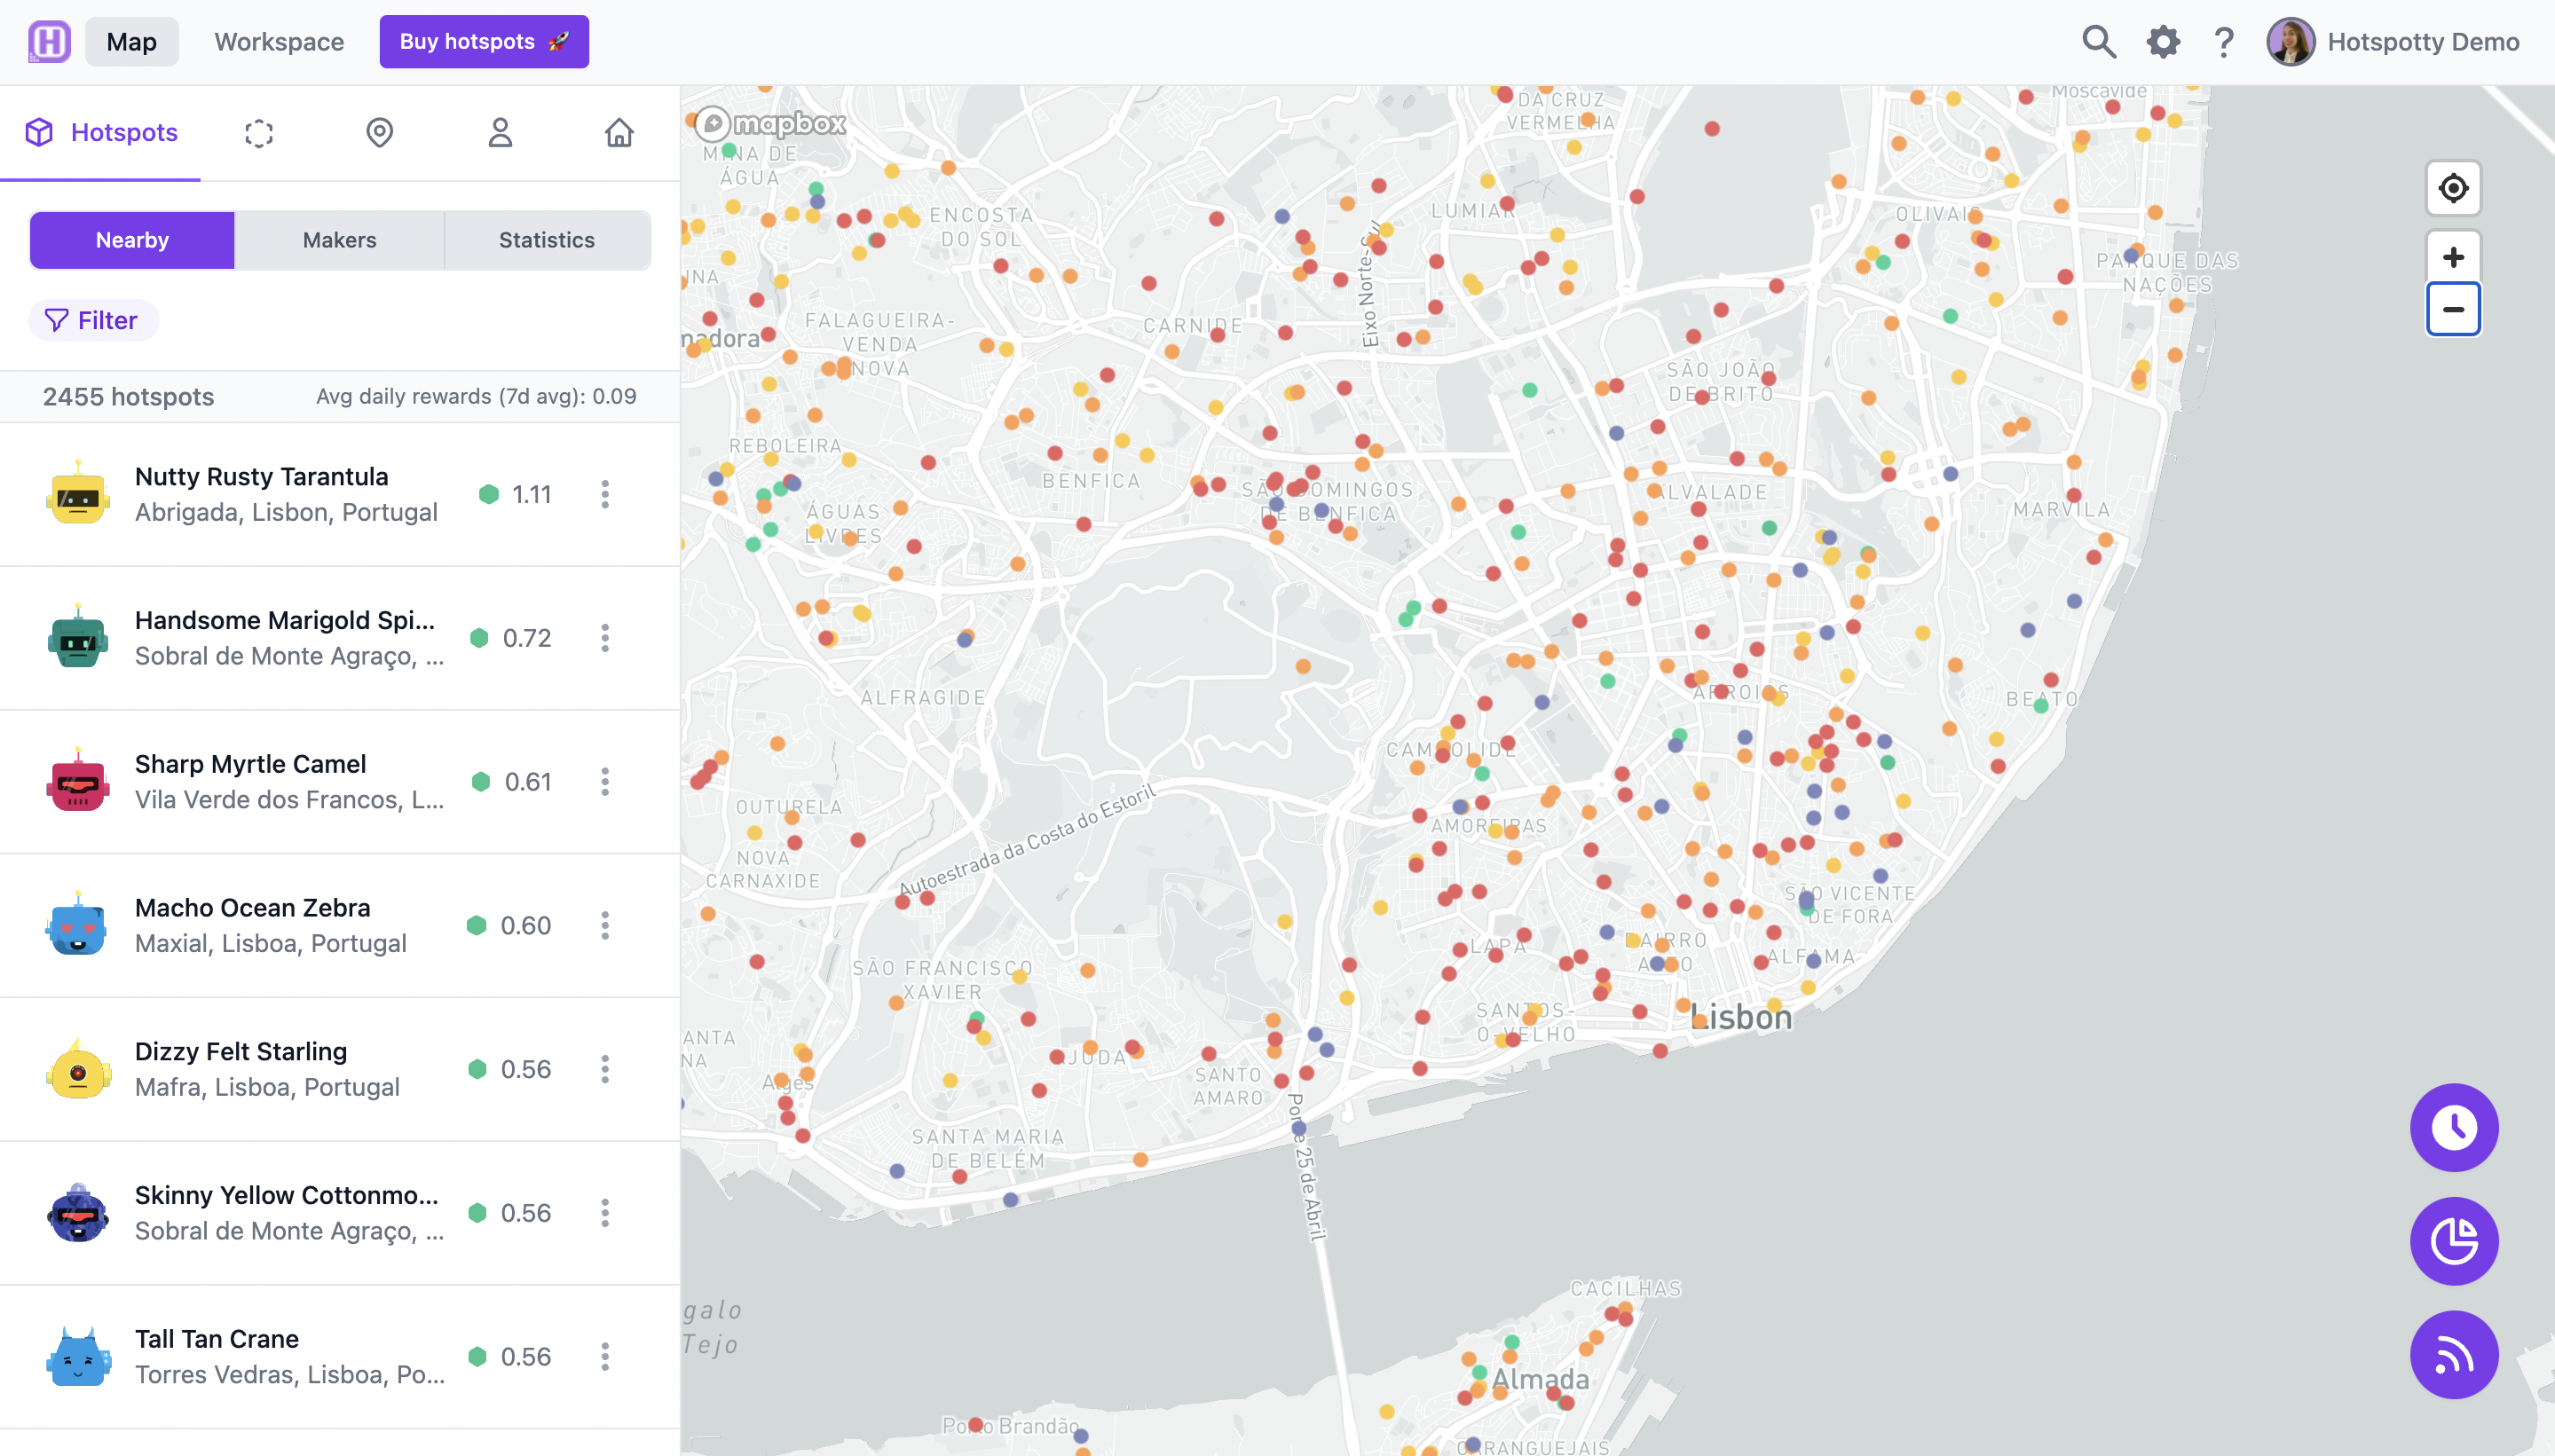
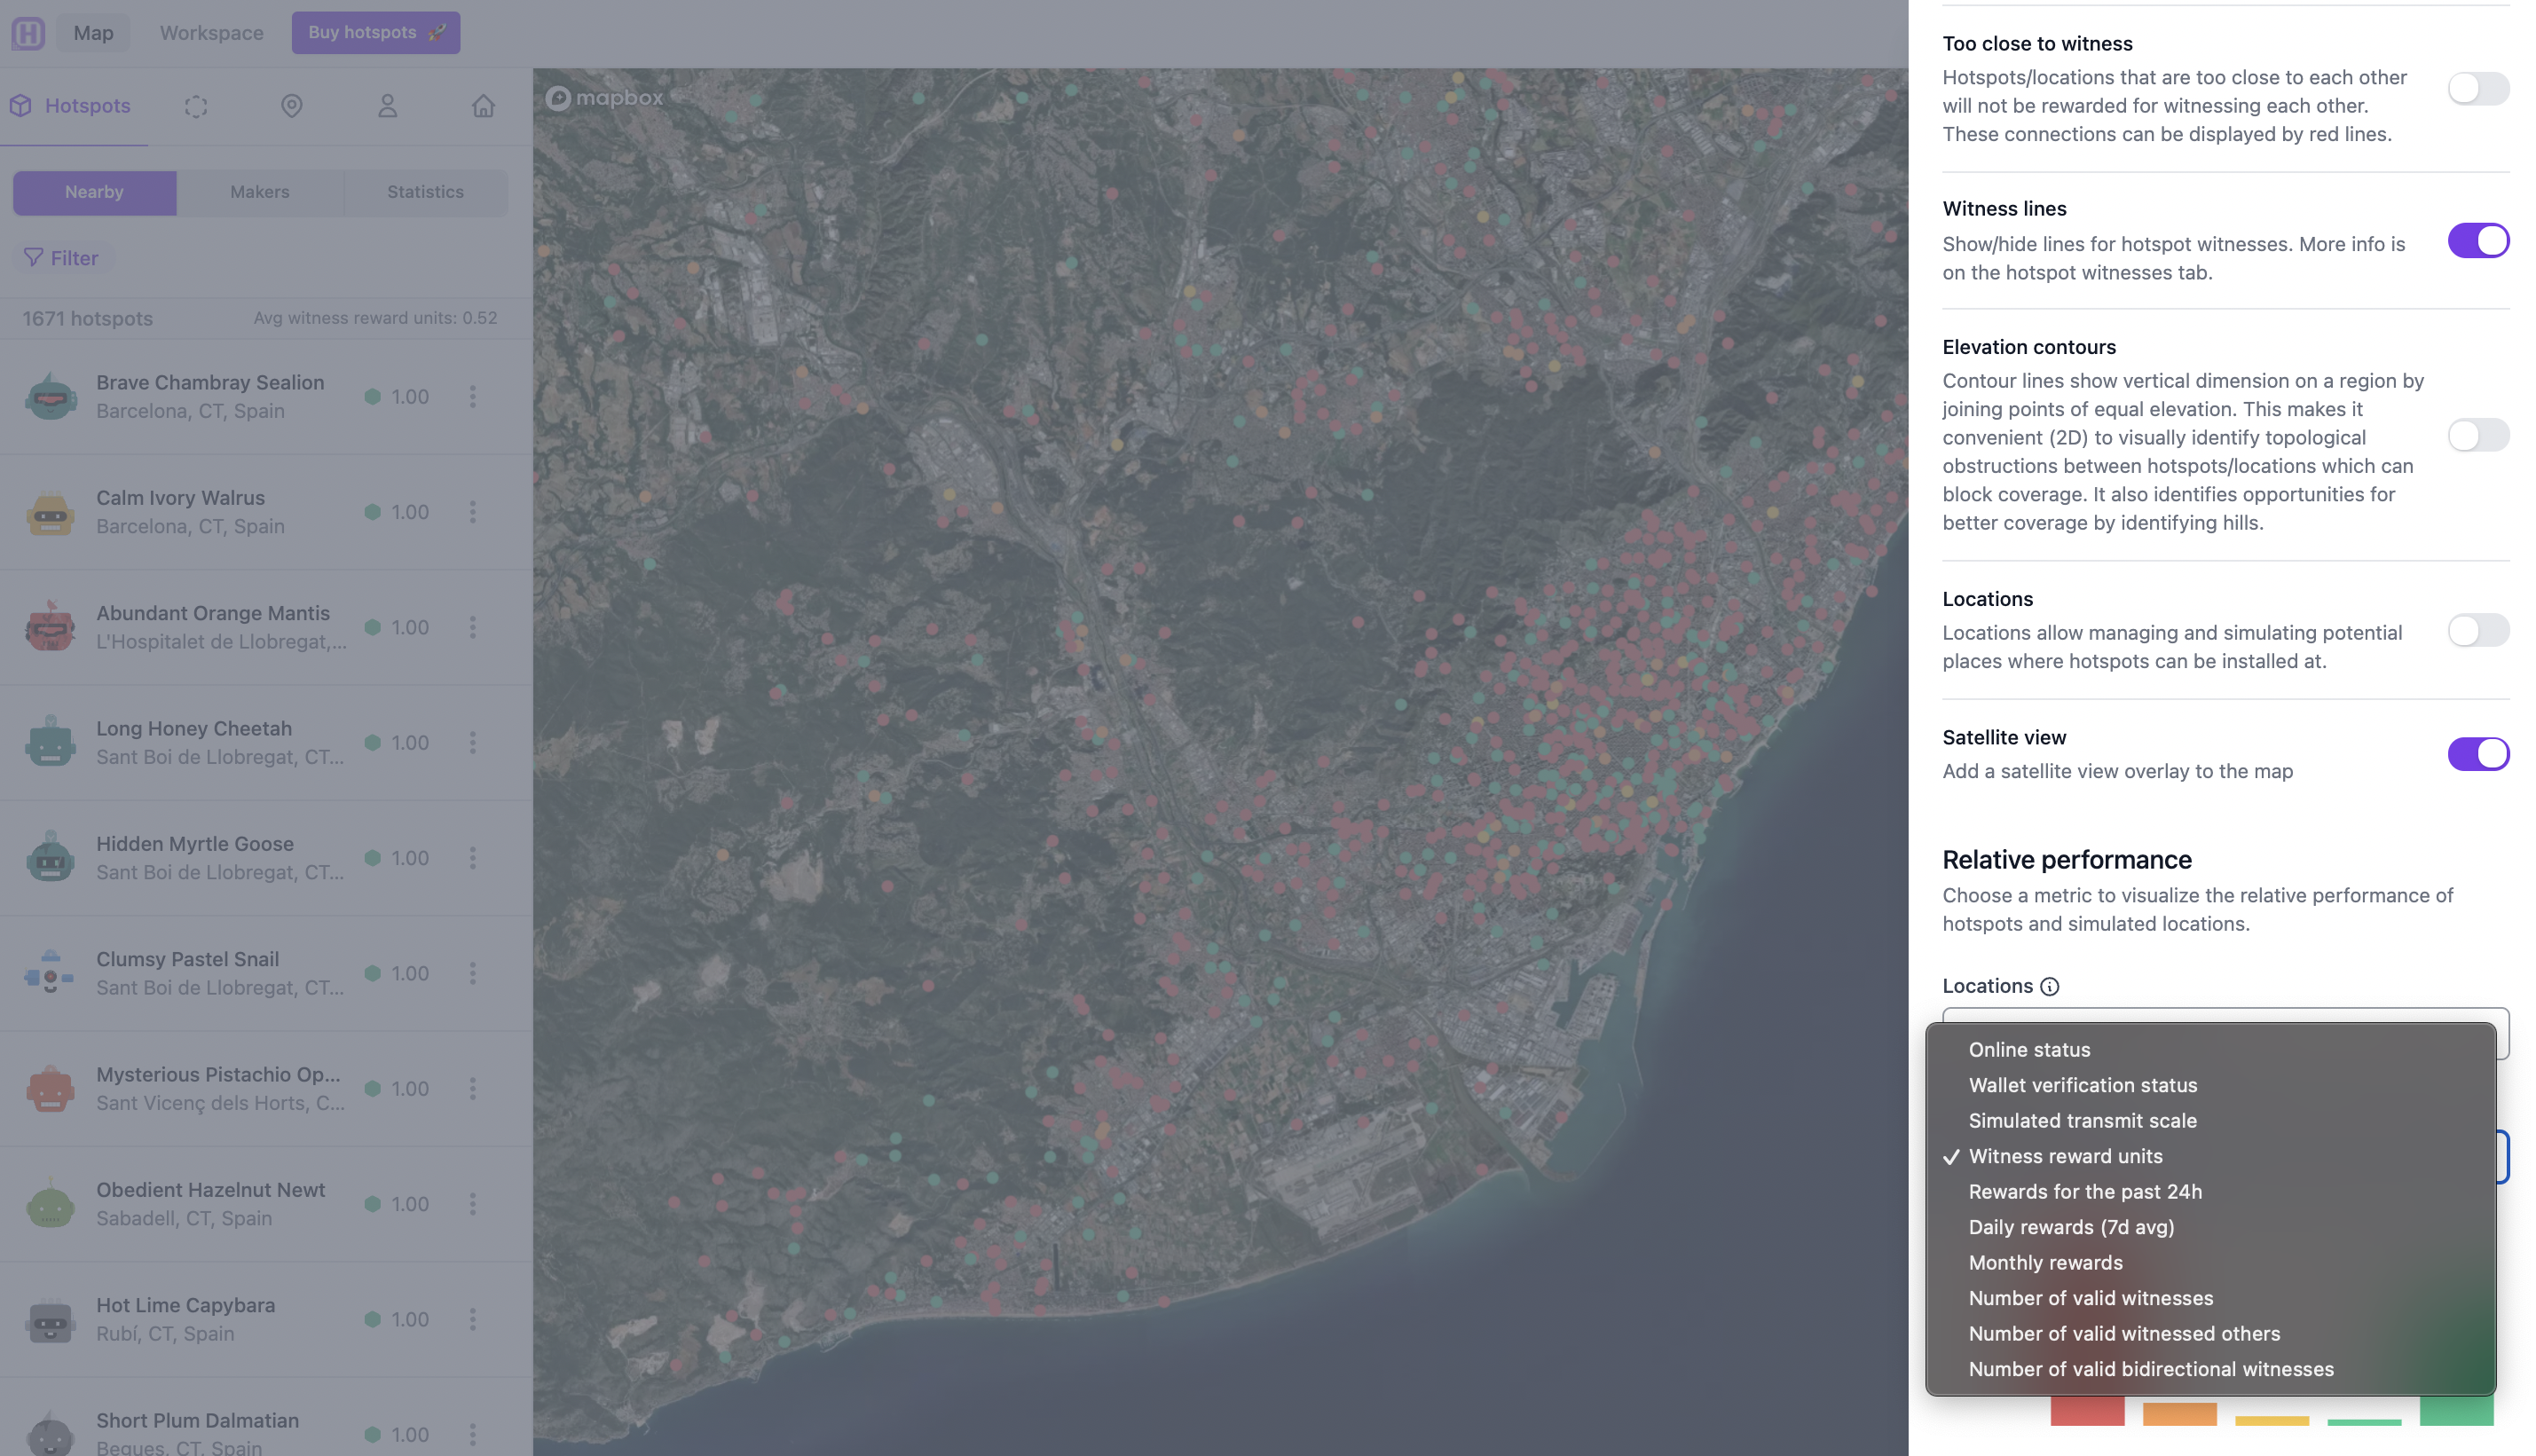
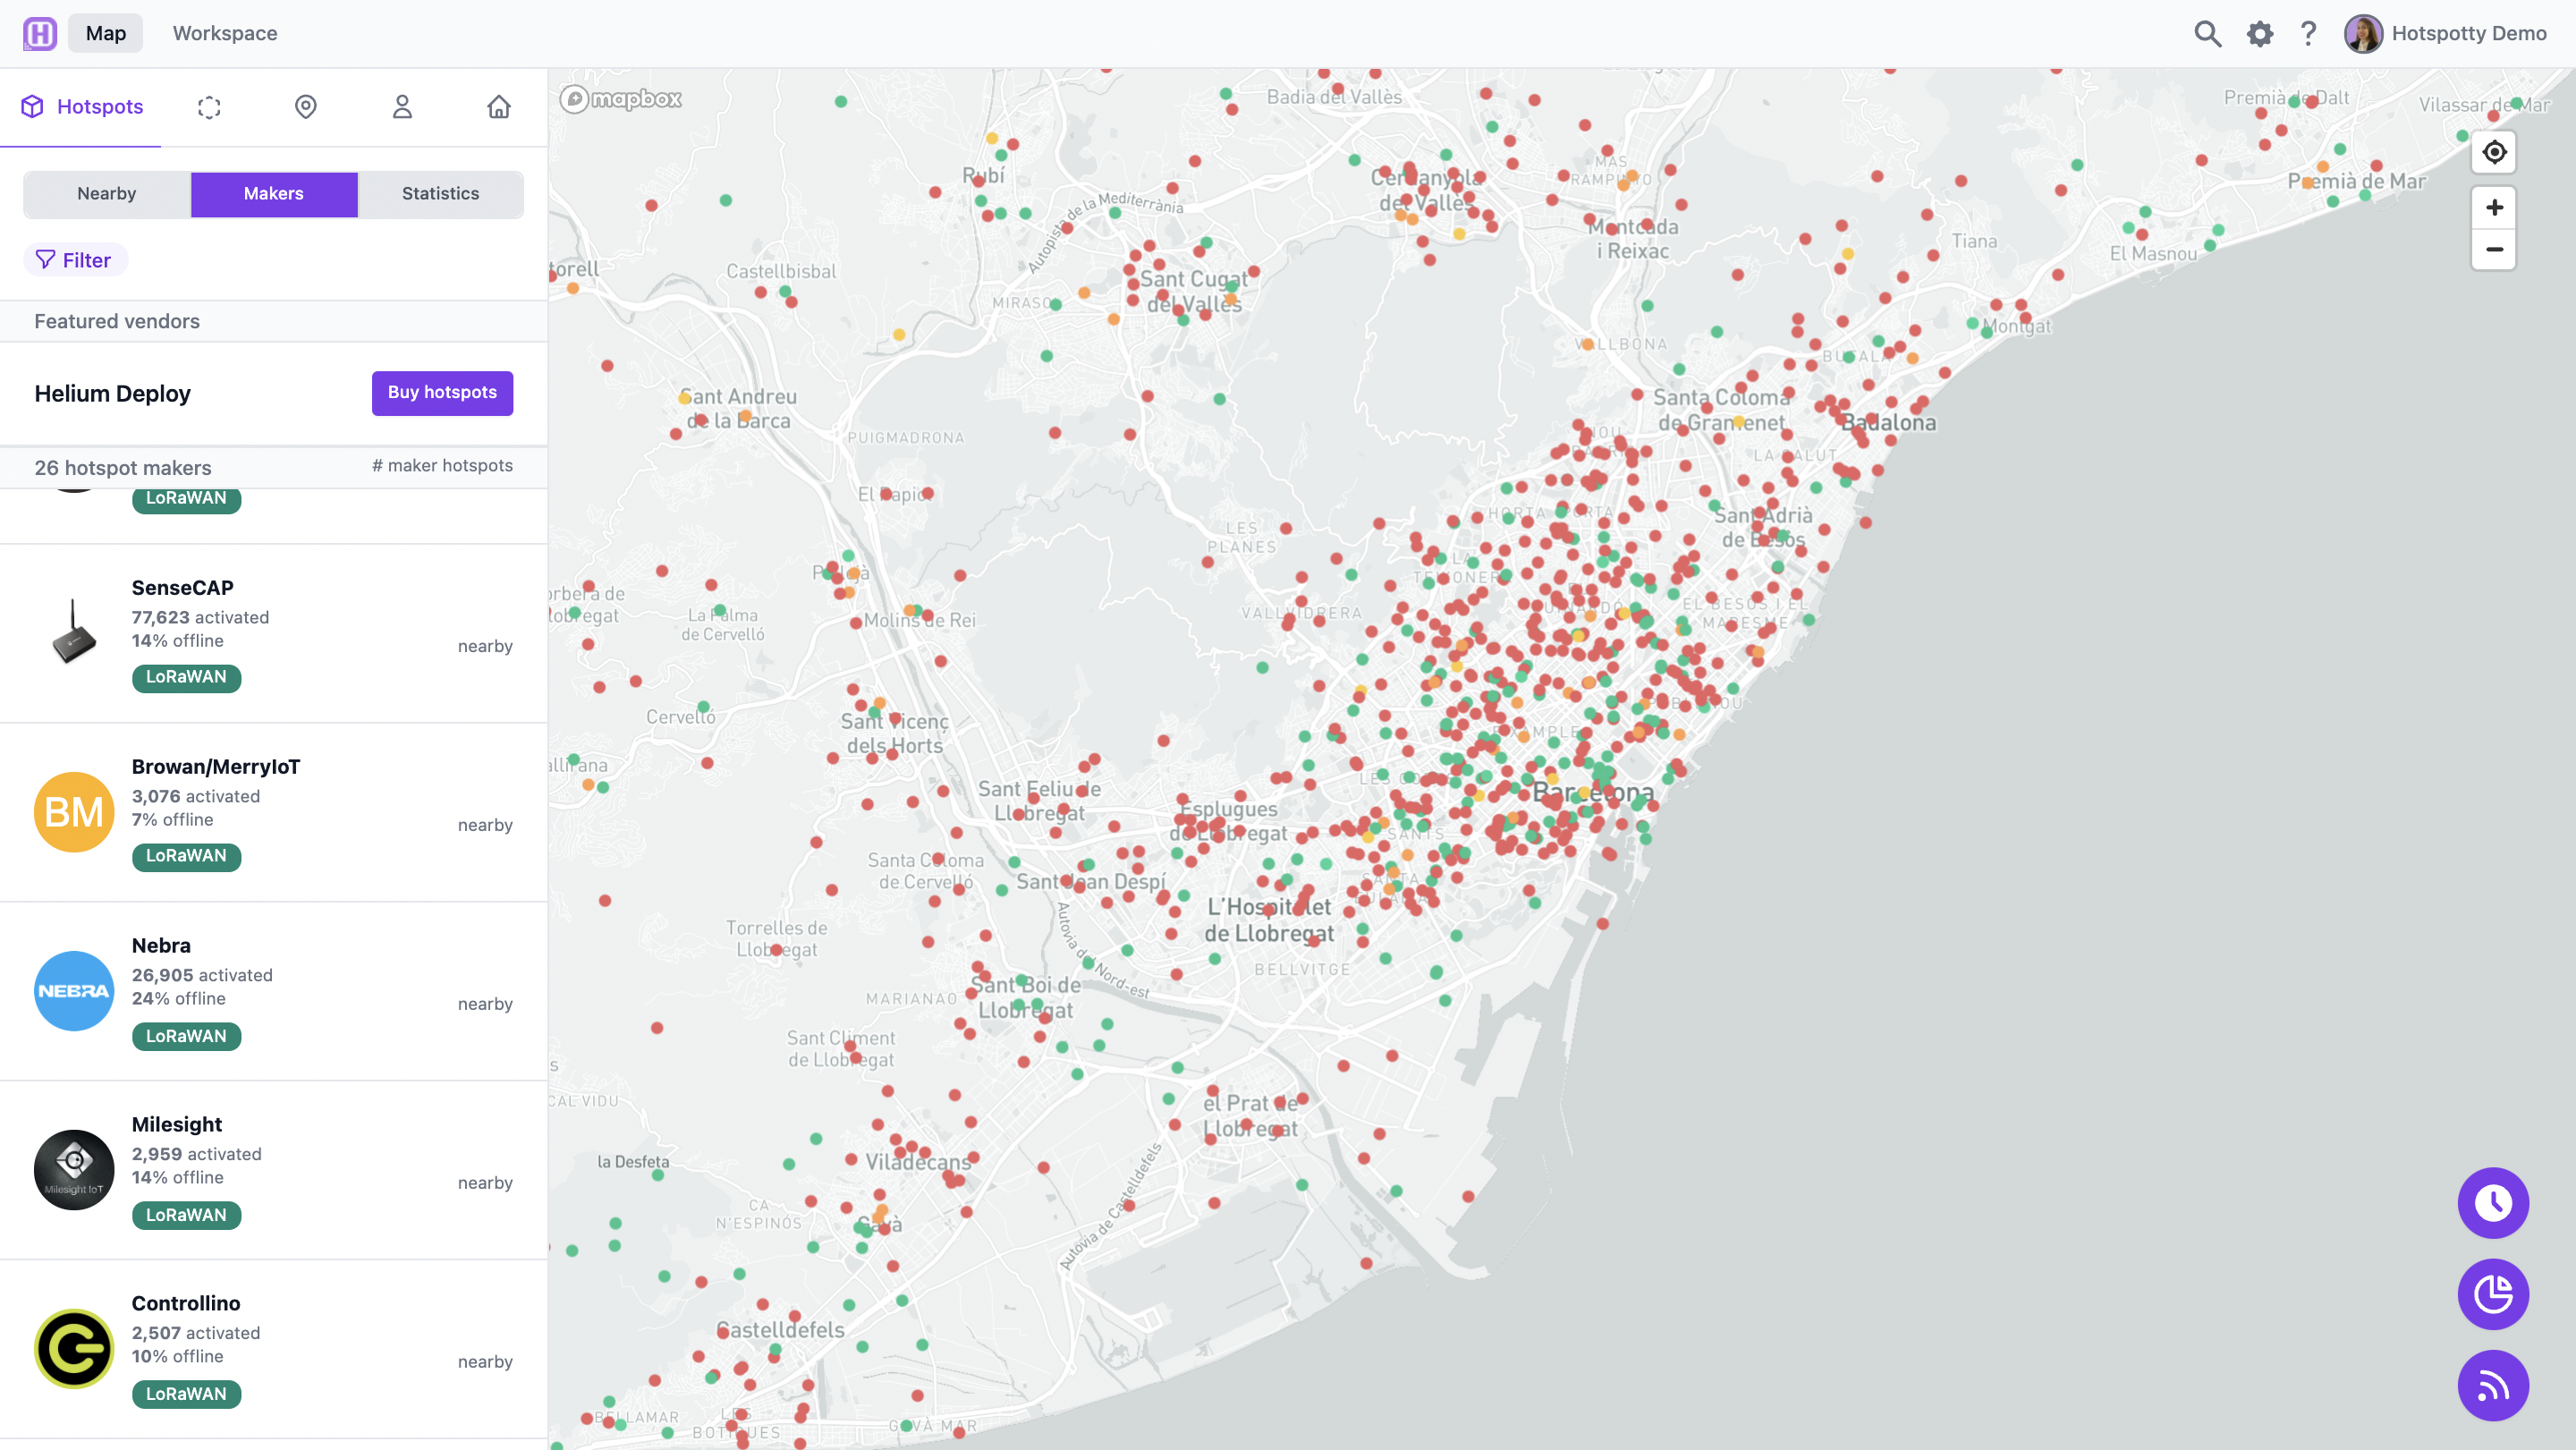
The map enables you to take a high-level regional view of hotspot distribution, congestion, and performance. See color coded hotspot statuses on the map according to a range of variables, including online status, simulated reward scale, reward factor, HNT rewards and witnessing types.

Understand relative hotspot performance

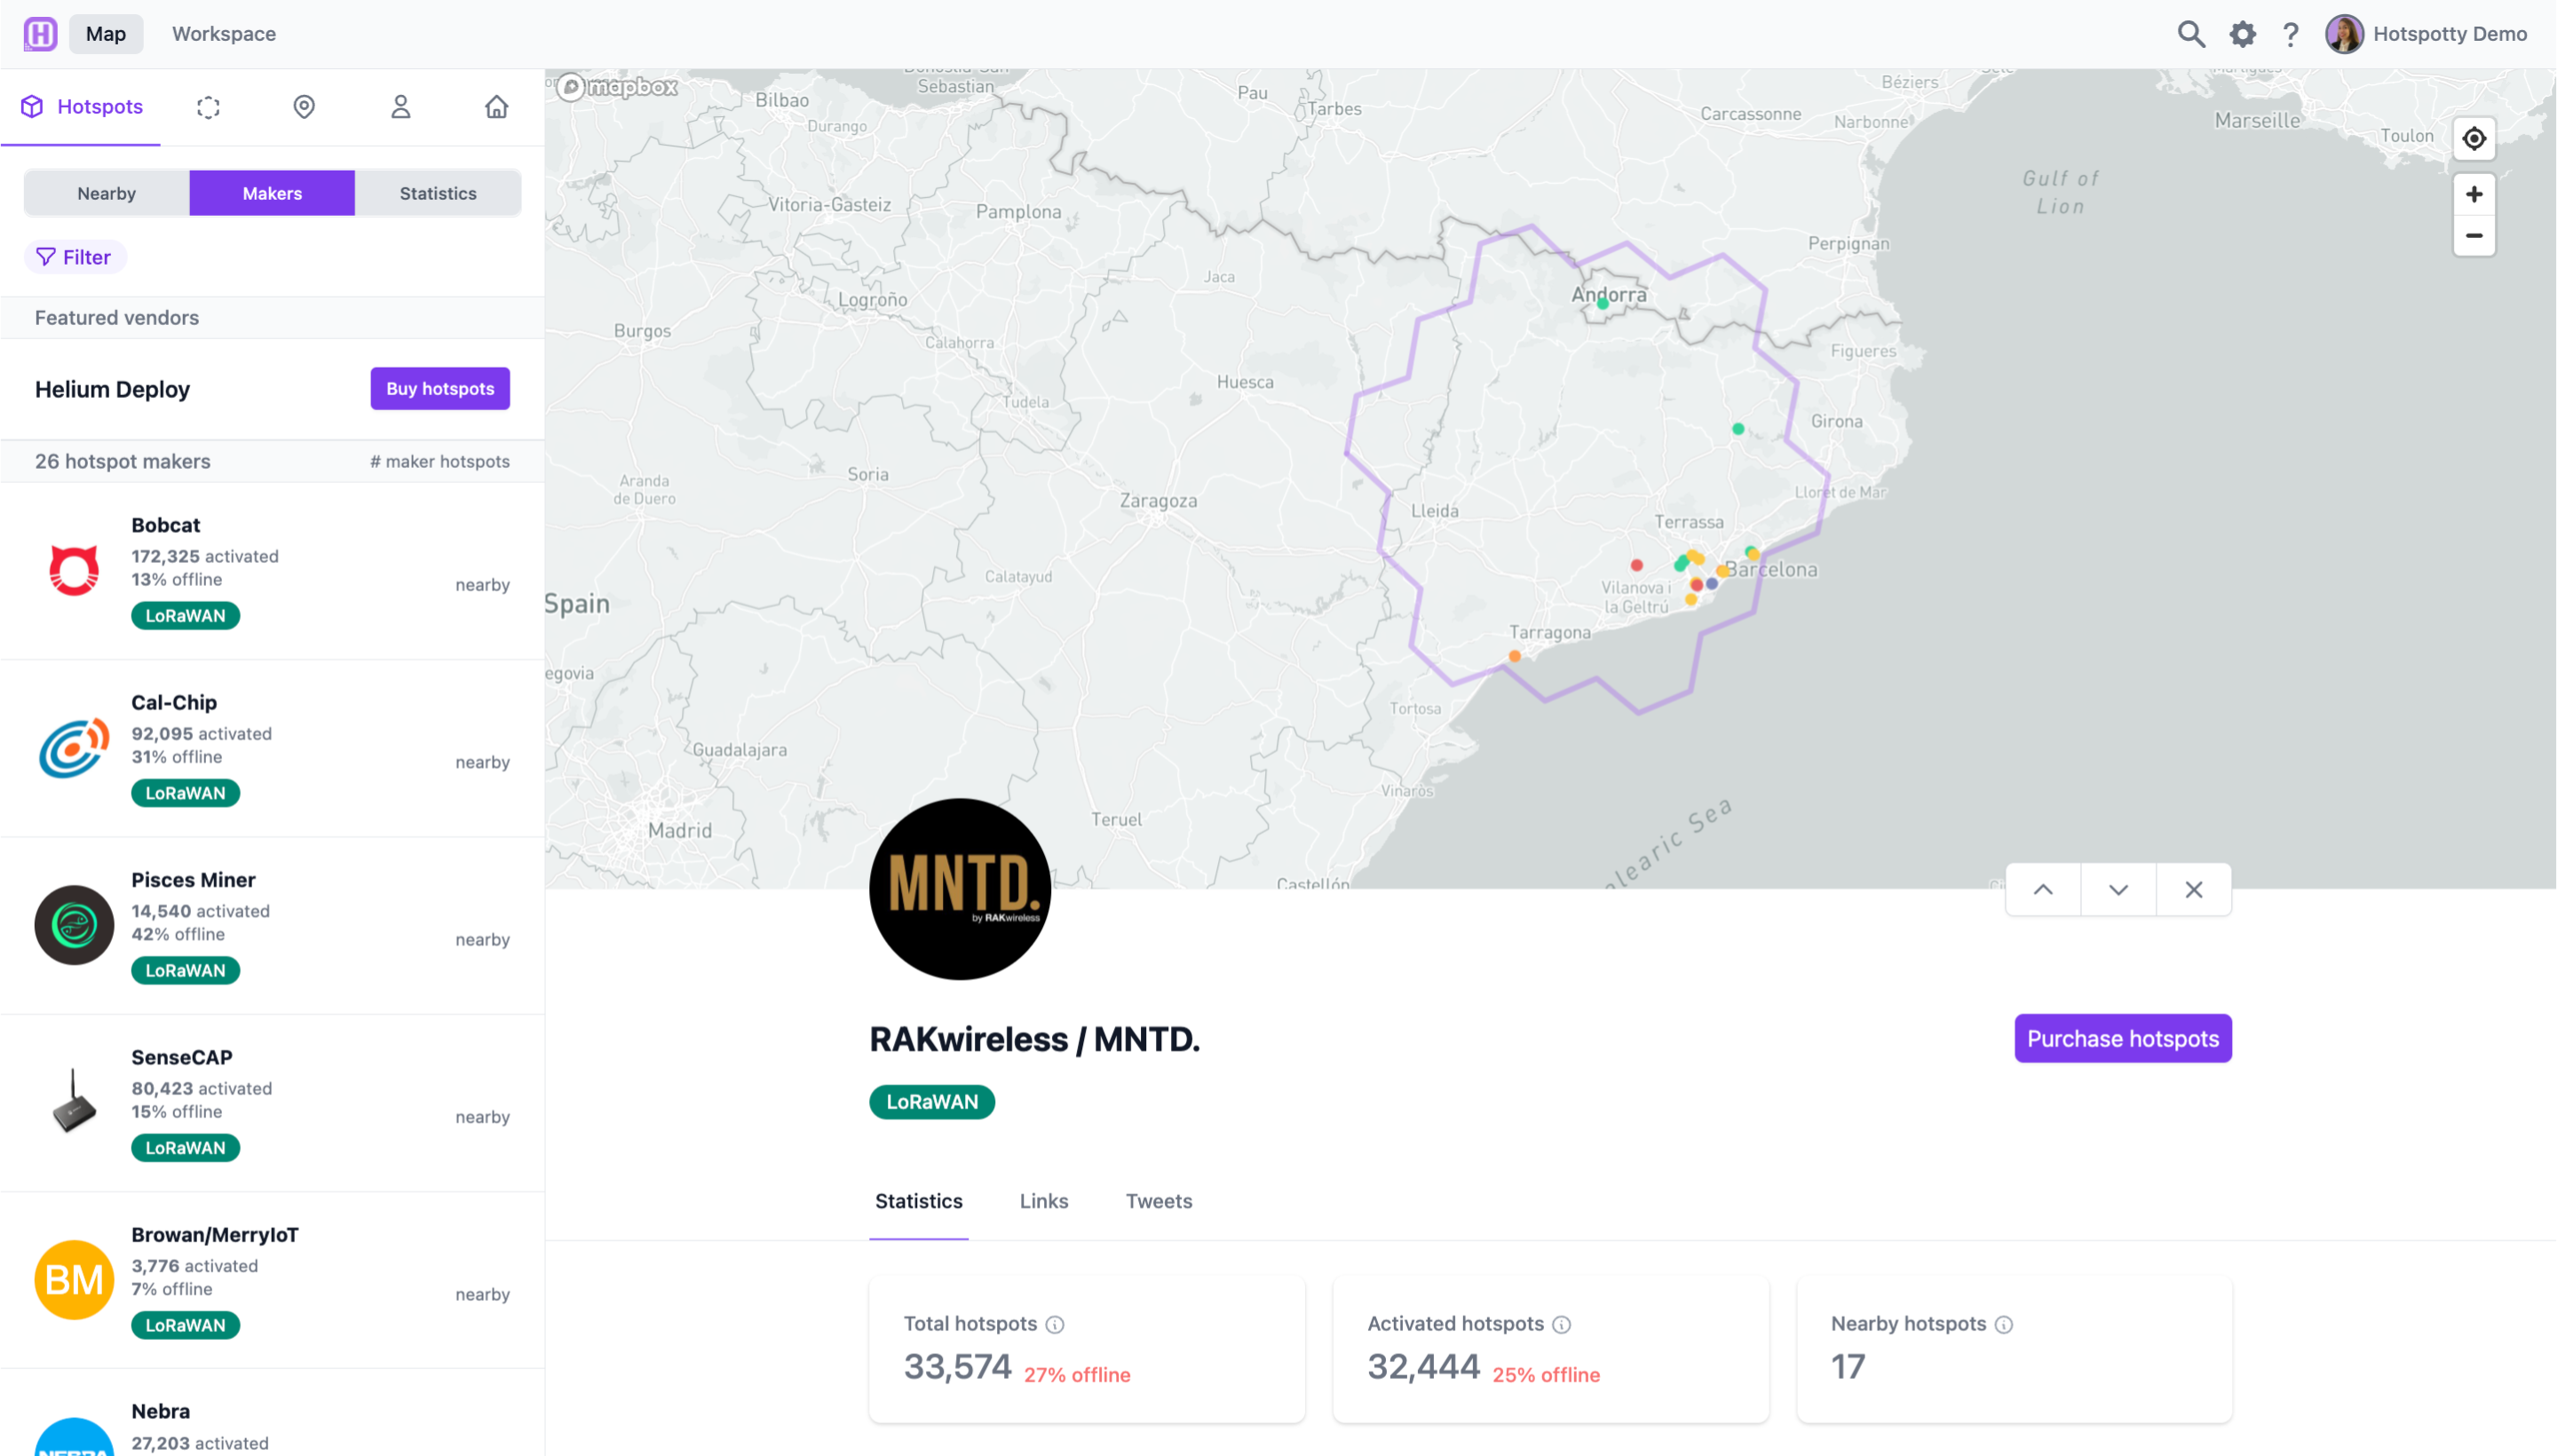
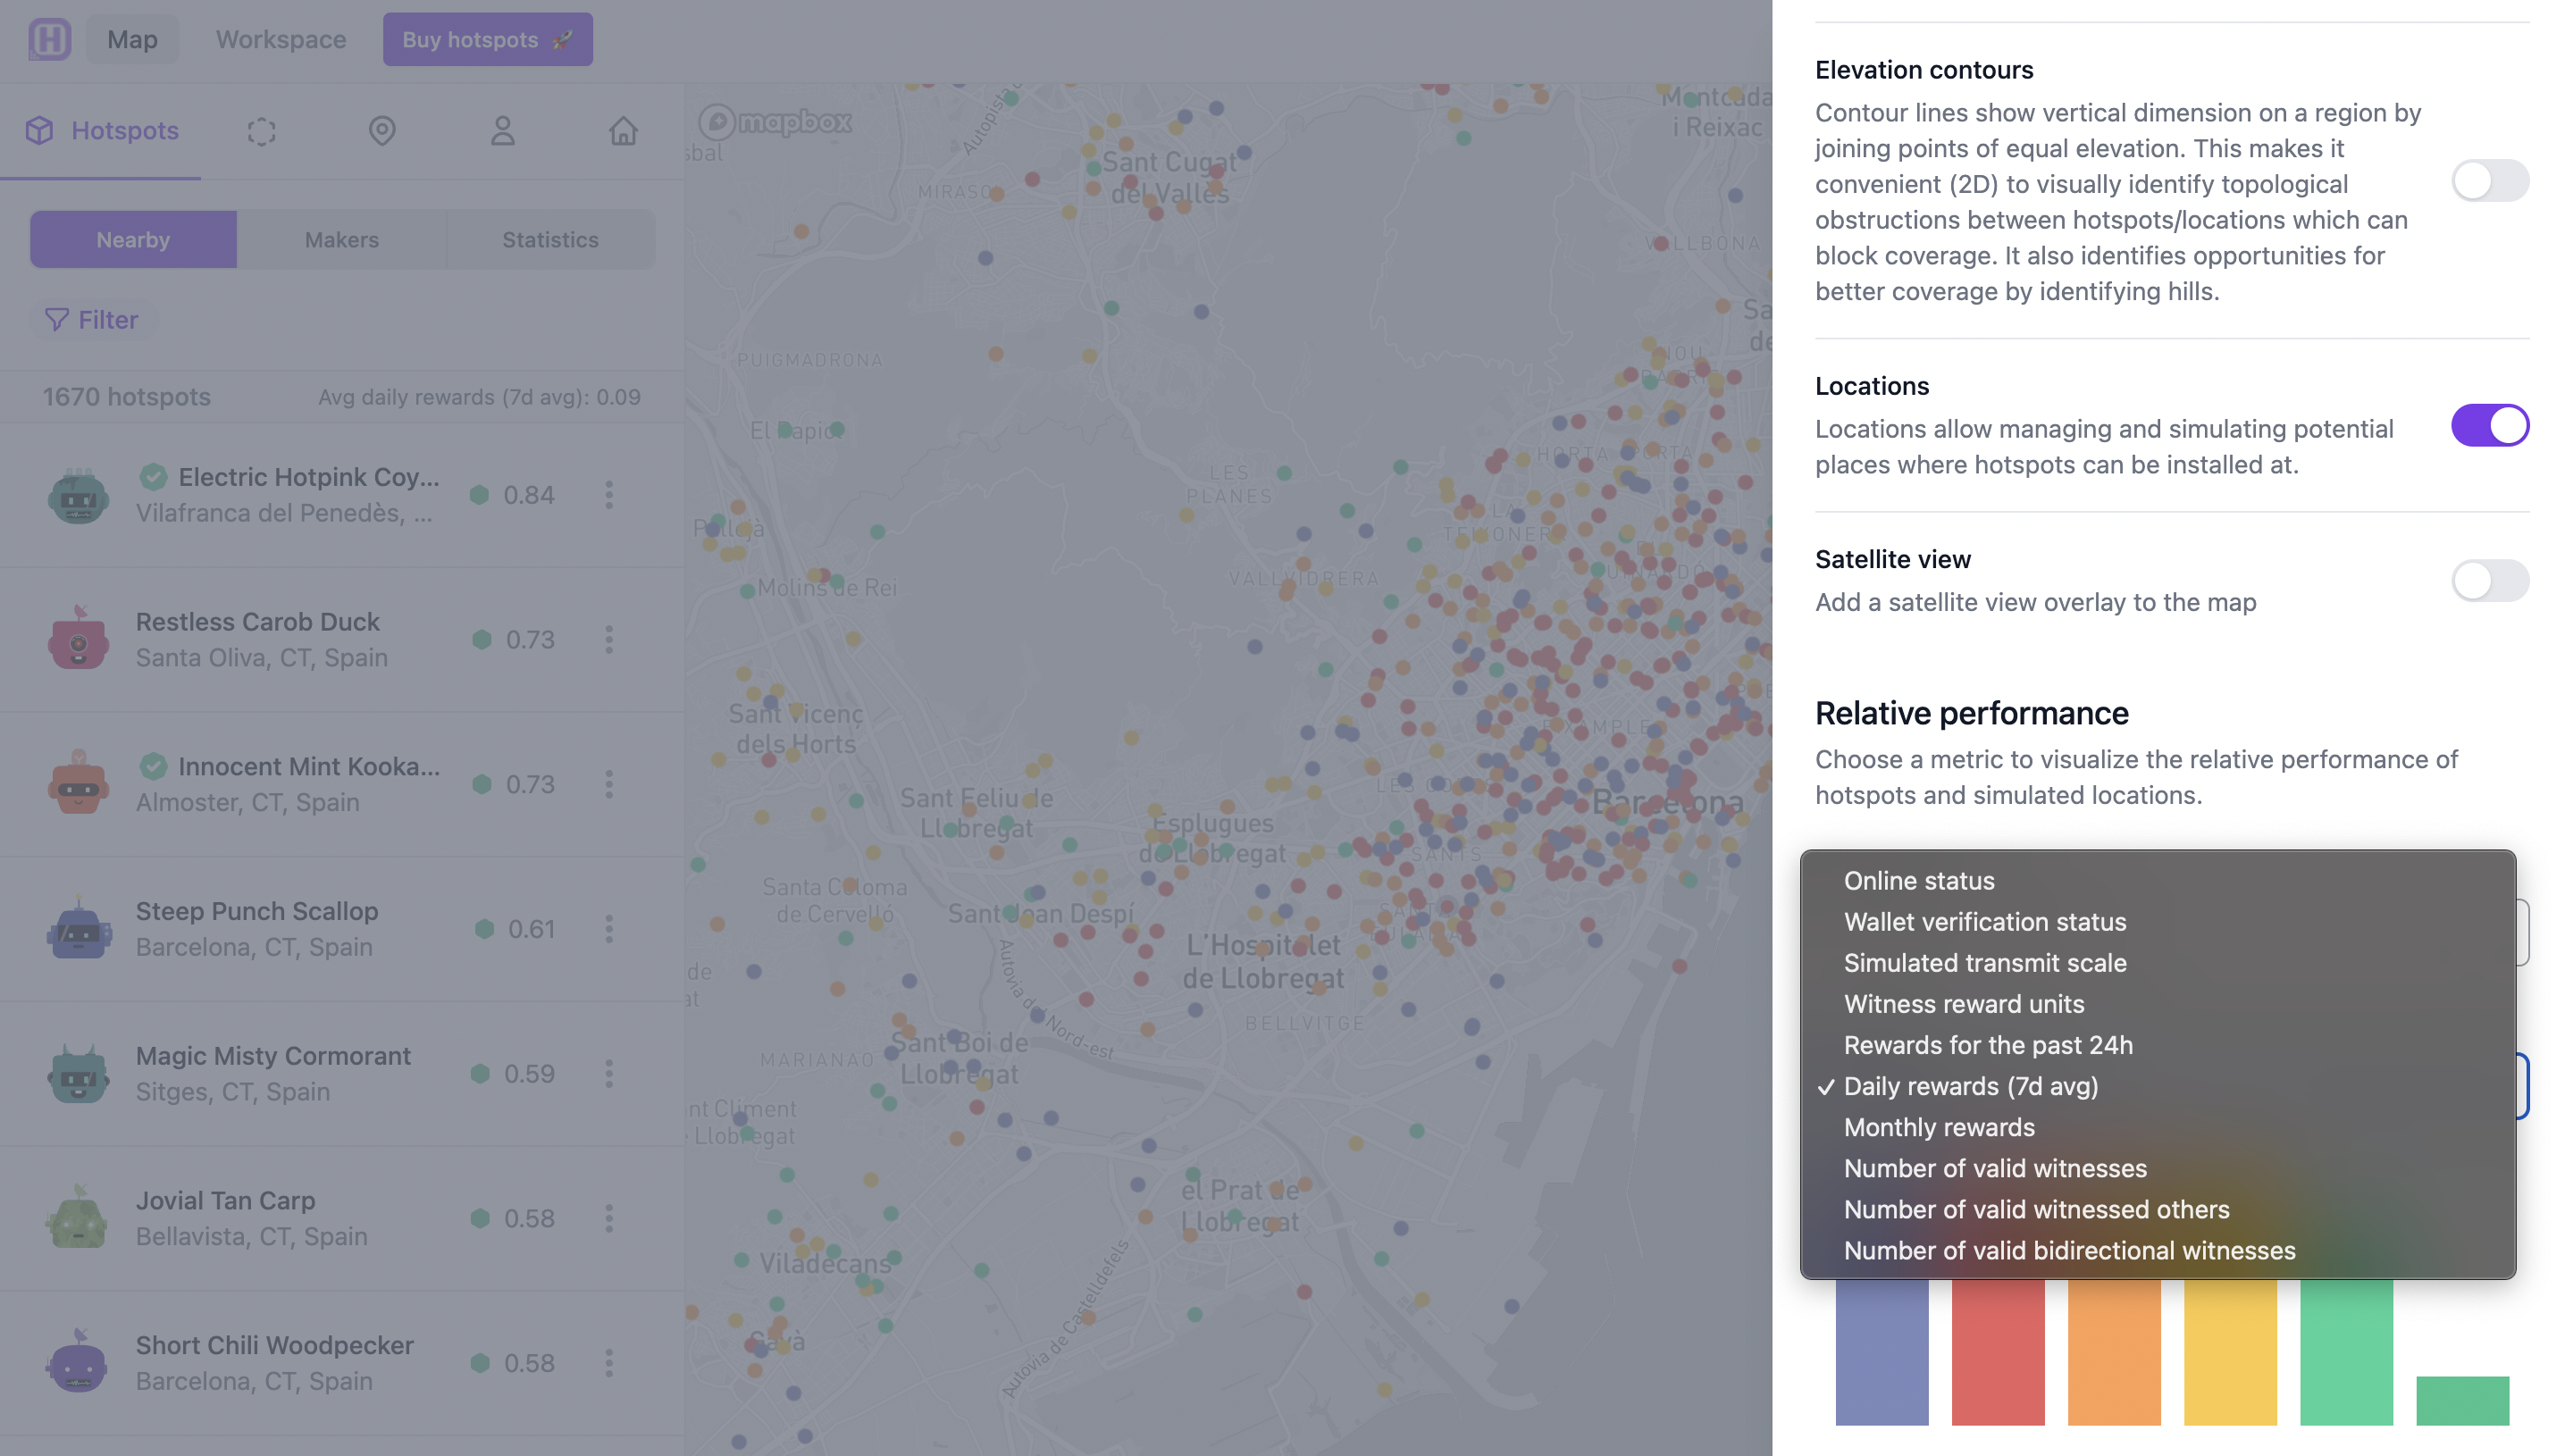
See how a hotspot is performing compared to others – and compared to potential new locations, according to a range of different metrics, such as simulated transmit scale, daily, monthly and seven day rolling average rewards, as well as valid bidirectional witnessing and witnesses an many more metrics.

Visualize how a region and each hex within it, is performing

The region dashboard enables you to easily see the number of hotspots in an area, as well as the average regional transmit and reward scales, and average rewards. It also shows you if a hex has too many hotspots, and if so how many would need to be removed – or if the limit can be increased.

Comprehensive transmit scale insights and optimization suggestions

Gain an in-depth understanding of the Helium transmit scale (HIP17) mechanism through visual and textual education and dynamically generated optimization recommendations.

Learn how the Helium network has - and will - evolve in your region

A ‘time travel’ function reveals exactly how hotspot population density has changed, and the impact this has had on the reward scale – showing just why advanced location planning and collaboration are so important.

Quickly access a list of Hotspot manufacturers with intelligent metrics

The makers hotspot explorer provides a list of all hotspot manufacturers, ranked by how many of their brand hotspots are activated and online and/or offline, with a list of helpful, informative and reliable links to the manufacturers resources.

1 Understand

Easily visualize and completely understand all your Helium hotspot data, on one platform.

2 Optimize

Manage, plan and optimize locations with advanced tools

3 Monitor

Monitor and manage all your hotspots in one place with advanced notifications

4 Collaborate

Collaborate with your team and the community with integrated Discord chat

5 Payout

Keep your hosts happy with assisted HNT and FIAT payouts

Want to take a look?

Get started or request a demo